

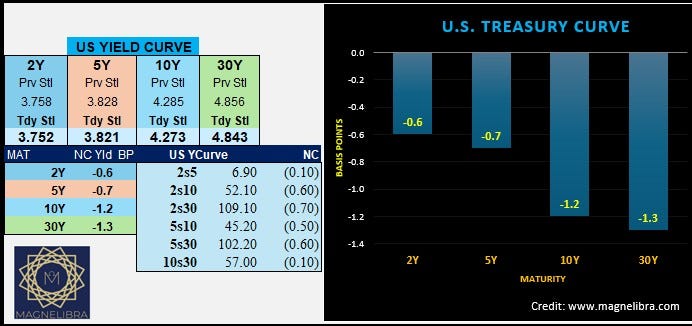
The U.S. Bond Yield Curve (This is our daily graphic displaying the U.S. bond market yield curve changes. We follow the 2 year thru 30 year durations. Please note that bond prices work inversely to yield changes so for instance if bond prices are rising and moving upward, then their yields are falling or moving downward. We also track the relationship between the durations known as US Yield Curve Spreads, when we list it as 2s5, we are comparing the yield differential between the 2 year vs the 5 year with the positive/negative viewed from the higher durations perspective.
U.S. Yields fell slightly on a lackluster day with the curve a tad flatter:
Magnelibra CTA Futures Market Trend Sentiment (Our proprietary commodity trading advisory futures market sentiment long/neutral/short market flows indicator) The portfolio is made up of the core futures markets we cover and the indicators are for single contracts of the futures market, whether long, short or zero neutral. The P+L is generated v…
