

Weekly Update March 13th 2018
Our weekly letter took a much-needed break last week, but we are back at it this week and look forward to only bringing you the good stuff. What better way to start than seeing what POTUS has been up to over the last few weeks. Well, true to form Trump didn’t fail on delivering cannon fodder for the global news networks and last week’s announcement of the U.S. imposition of global tariffs, left pundits with plenty to chew on. Most of the talk focused upon China and the impending trade wars. The analyst’s in us believe this is more of a NAFTA posturing from the position of power in trying to renegotiate that deal. Now that doesn’t mean all powerful Xi Jingping wouldn’t use it to further assert his power, as if designating himself supreme leader for life wasn’t enough. We know the facts and the facts are Canada and Brazil are our main sources of steel. Now we don’t want to lose sight that Trumps America first agenda isn’t well received with the globalist’s agenda and thus political posturing is definitely a byproduct, but Trump will waste no air time in displaying his authority on the matter. This is clearly demonstrated in his tweets:

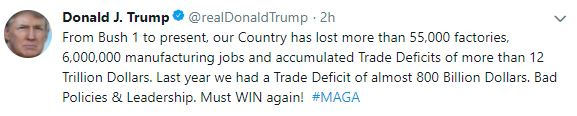
With his constituents the clear target of his tweetstorm, it solidifies his platform or #MAGA to all those doubters, naysayers, etc. We don’t always agree with his in your face type of gamesmanship, but it shows a whole lot of a tenacity, that’s for sure. As much as people don’t like it, we would rather have a strongly convicted leader than a waffler any day of the week. This is a clear blow to the TPP globalist pushing agendas out there and yes it smells a bit like protectionism and it will have consequences, but it is why Trump won and we suppose he is just following through with a few promises.
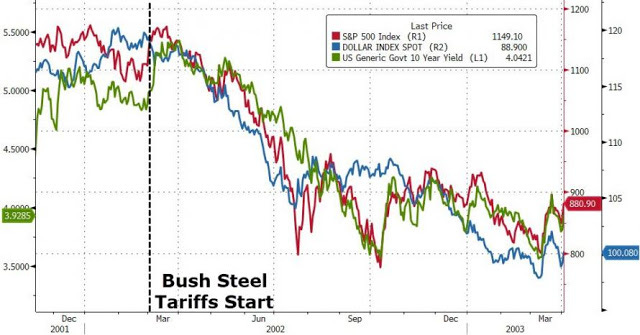
As for the markets, they put their usual AI HFT kneejerk reaction in but the markets have taken it all in stride. One chart we saw from Zhedge on this matter was an analog to when Bush2 enacted steel tariffs in 2002, which saw the SP500, bond yields and the dollar all fall in unison:
What else did we hear last week
Kuroda and the BOJ were talking up revisiting their easing policy and a possible exit…yeah right…Their unemployment rate sits at a 3 decade low and still no inflation, so much for the Phillips curve right
The US released its annual financial report last week and it showed a net loss of $1.2 Trillion for 2017…gee can you imagine the loss as rates rise and the expansion turns into a recession? We certainly can, are we prepared, hell no
New Jersey actuaries raise pension discount rates to 7.5%, nothing more than political posturing to make a budget look better than what it is, extend and pretend most people like to call it. Then again, the commoner is none the wiser, that is unless you read letters like ours
New figures on Libor based derivatives is $200 Trillion some 25% higher than expected, now most will say that is not net, but regardless a massive sum to say the least and to put that into perspective the Dv01 or 1% rise in interest rates is an extra $2 Trillion dollars, try to hedge that
The “Volcker Rule” will undergo changes, the most obvious is to lessen capital restrictions and usage, so that the banks can trade and make money since it basically forced a mass exodus of prop traders out of the IB space and into the hedge fund space, it’s been a decade the people don’t care about risk anymore
January trade deficit was up a massive 5% to $56.6 Billion, the largest was with China at $35.5B
Rex Tillerson is out and Mike Pompeo in as new Secretary of State-widely expected
We read a great piece from Michael Lebowitz via RealInvestmentAdvice.com on valuations, specifically highlighting the current CAPE ratio which sits at a lofty 33.41. Michael did a great job in showcasing the relative returns when investing when CAPE is at such an elevated level, here is what he said, “With the current CAPE at 33.41, investors should expect an annualized excess return for ten years of -2.04%. Based on historical data which includes 32 full business cycles dating back to 1871, the best excess return experienced for all instances of CAPE over 30 is 0.39%. Over this 147-year period, there have been 57 monthly instances in which the CAPE was above 30. Only four of these instances provided an excess return over Treasuries and the average was a paltry twenty basis points or 0.20%.” Now we know we live in unprecedented times whereby central banks have been pedal to the metal with their liquidity driven programs, so we need to respect that power. Second, we know the U.S. has made fiscal reforms to complement such monetary ease, in the form of lower tax rates. The environment that this has all created is one by which every firm is now financialized and incentivized to play interest rate games and instead of CAPEX spending, free cash flow and debt are being used to buy back stock. These are very powerful forces to reckon with and ones in which we think are the driving forces for such a powerful, long lasting linear equity run up. Here are early 2018 Buyback numbers:
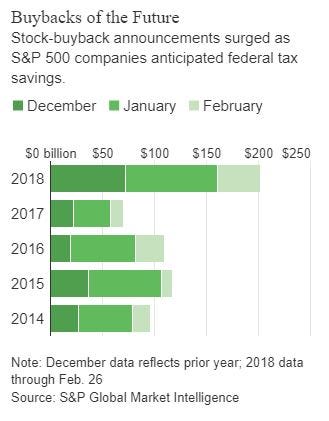
As you can see 2018 has already dwarfed the past 4 years in terms of velocity of buybacks to start the year. This type of spending by corporations which at this pace is at an annualized rate of $800 billion is a considerable fundamental force. So, when fundamental driven analysts use metrics like CAPE, as much as we admire their prowess, contextually it must be fully recognized versus what the current economic environment is like.
This chart from Zhedge demonstrates further value stretching metrics via central bank provided QE:
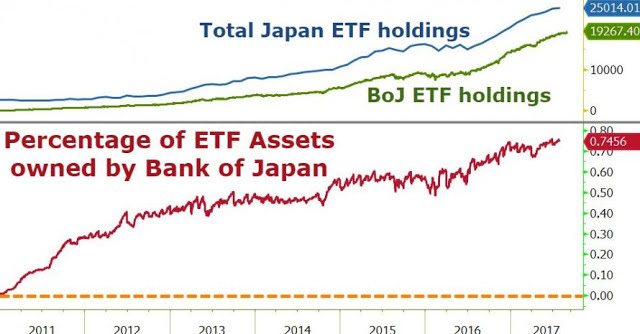
When you have a very large non-zero-sum player such as the BOJ and their purchases when they print money. It doesn’t take much convincing to realize that when you print money and buy real assets, said real asset prices nominally rise. As that last chart states, in a little over 6 years, the BOJ has bought up nearly 75% of the Japanese ETF market. That is straight up counterfeiting but made legal by central bank decree.
The Dems are starting to point out that the tax cut is nothing more than a wealthy subsidy once again, and despite not agreeing with their political posturing, they are correct because who benefits from buybacks? Well when the wealthiest 10% of the people own 84% of the equities, it doesn’t take a genius to figure things out.
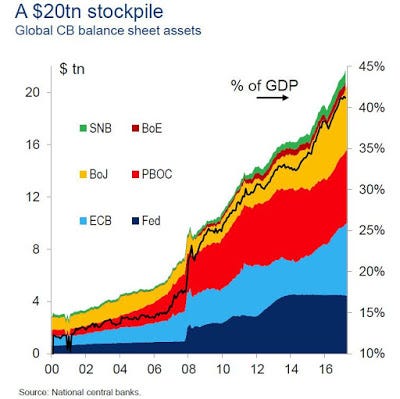
When we look at the global central banks combined, you can see that even if the FED reduces its balance sheet, in the large scheme of global QE central banking, its rather easily absorbed:
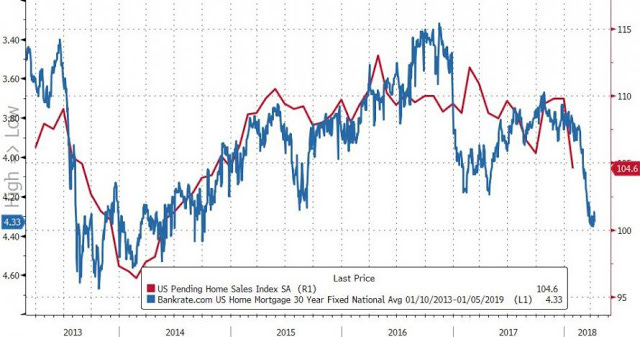
With 10-year yields stuck near 2.87% we feel that the broader mortgage market is starting to see the effects of higher rates. On a nominal basis a 1% rise in mortgage rates doesn’t seem like much, but it can play a significant qualifying threshold for some expecting borrowers to overcome. The above chart plots the 30yr yield inversely vs pending home sales, as yields rise or in this chart are inverted so moving downward, home sales usually follow it lower:
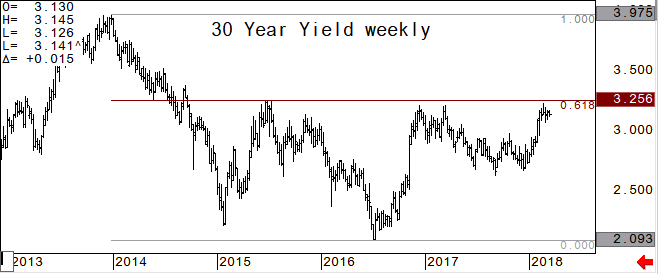
Let’s move to a few technical charts and since we just mentioned the US 30Y bond:
As you can see the 3.25% level has capped it for the last 3 years. If it is tested and broken we would expect it to not stay above it for very long and would be more of a head fake move if anything:
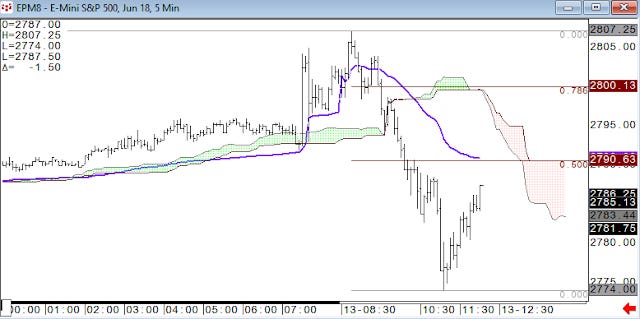
As far as the SP500 future the 2800/2807 level continues to provide resistance with 2745 below key support now:
The other markets seem to be in a bit of a standstill:
Gold is in a range around $1325
Oil is hovering around $60
The Yen has been strong lately staying above 92.00 and still seems bullish
The Euro above 122.78 is key
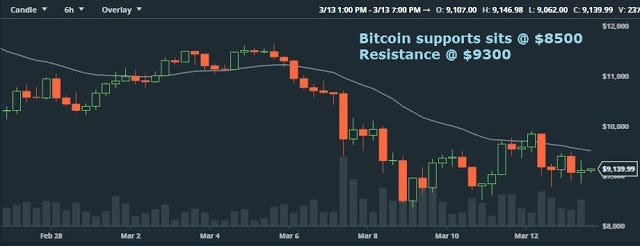
We cover Bitcoin in our weekly CryptoCurrency letter, but here is a quick chart. Resistance comes in above near $11700 and key support is $8500, but its spent the last few days hovering right near $9000:
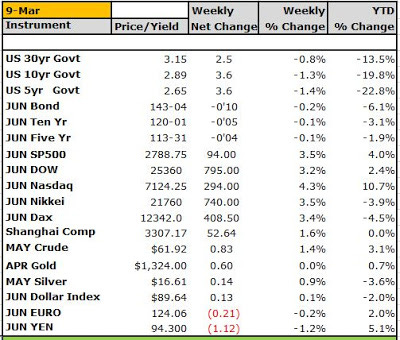
As usual we leave you with the weekly settles, Nasdaq is this year’s standout up 10.7% with the Yen in 2nd place. The loser is the bond future down 6% so far. Anyway, we hope you learned something today and that you continue learning and extending your knowledge base, Cheers!
DISCLAIMER: For Educational purposes only. This is not a solicitation to buy or sell commodity futures or options on neither commodity futures nor an endorsement for the purchase and sale of ICOs or Cryptocurrency and should not be construed as such. The risk of trading securities, futures and options can be substantial and is not for everyone. Such investments may not be appropriate for the recipient. The valuation of futures and options may fluctuate, and, as a result, clients may lose more than their original investment. Nothing contained in this message may be construed as an express or an implied promise, guarantee or implication by, of, or from the author Mike Agne of Agne Asset Management LLC (AAM) and owner of www.econemotions.com and The CryptoCorner Newsletter, that you will profit or that losses can or will be limited in any manner whatsoever. The CryptoCorner logo and name is the sole right and property of (AAM). Past performance is not necessarily indicative of future results. Although care has been taken to assure the accuracy, completeness and reliability of the information contained herein, (AAM) makes no warranty, express or implied, or assumes any legal liability or responsibility for the accuracy, completeness, reliability or usefulness of any information, product, service or process disclosed. DO NOT COPY OR FORWARD INTELLECTUAL PROPERTY WITHOUT PRIOR WRITTEN CONSENT AND OR APPROVAL.