

We always here the old cliche, “the calm before the storm” when it comes to the sheer complacency and lack of emotional buildup, which then finally gives way and ushers in this spectacular mad rush of emotion that sends volatility higher and shakes equities off their high levels. We aren’t ever really sure of the timing of such things, yet we can start to piece together a couple of narratives that may provide us with some clarity, some insight into the final unraveling of an economic bubble. One of the biggest indicators of a bubble for us right now is this next chart plotting the Home Value to Income Ratio:
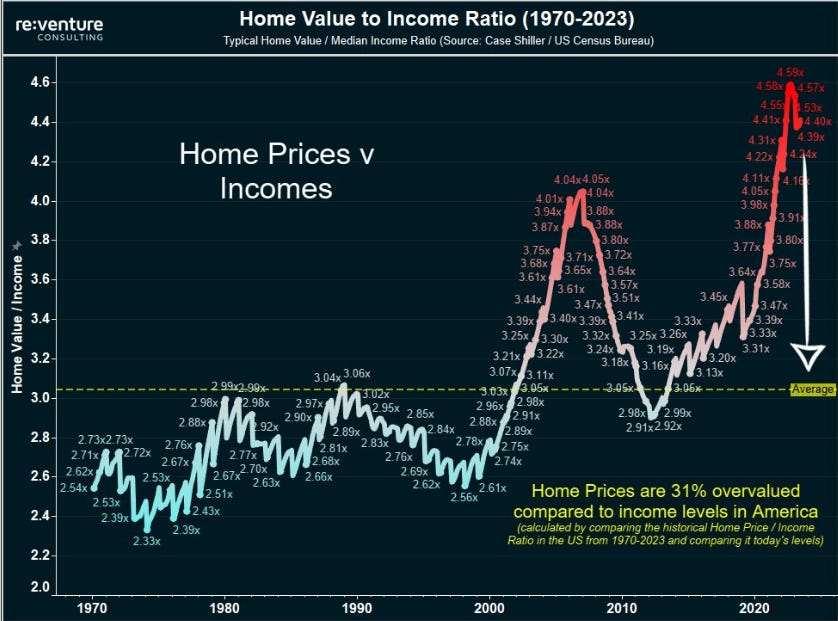
We love this chart its just so clean to us, and what is more painfully obvious is the fact that the last 23 years, we have seen a mad rush into Real Estate to generate wealth and FOMO. 2008s collapse from an even lower level than today is not a good sign for those hoping this train will go on forever!
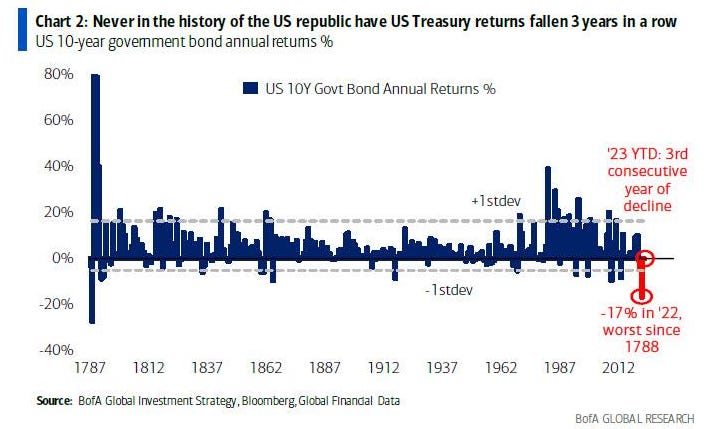
Another bubblicious chart we like is the end of the Zero bound and low rates for US treasuries. If 2023 ended in August, this would mark the third consecutive yearly decline. Not the best look for risk parity and all those 60/40 funds so heavily reliant on balanced returns.
What has become a constant narrative and one we poached a long time ago was that the MEGACAPs like Apple for instance are now the de-facto “risk free” investment benchmark, being able to borrow at lower rates than the US government itself and this we believe has had profound rebalancing effects. This is also why SocGens Albert Edwards continues to be stumped by the lack of interest cost at the US corporate level…ahh but we know better, we know the tide has shifted and we know corporations all of which have sacrificed CAPEX spending for productivity improvement for Modigliani and Miller shifting in their capital structure, i.e. taking on massive amounts of debts to roll debt into perpetuity for survival. This next chart should open your eyes as to what is coming for all these zombie corps, let’s just say their interest costs are about to go 2 and 3x over the next year and a half:
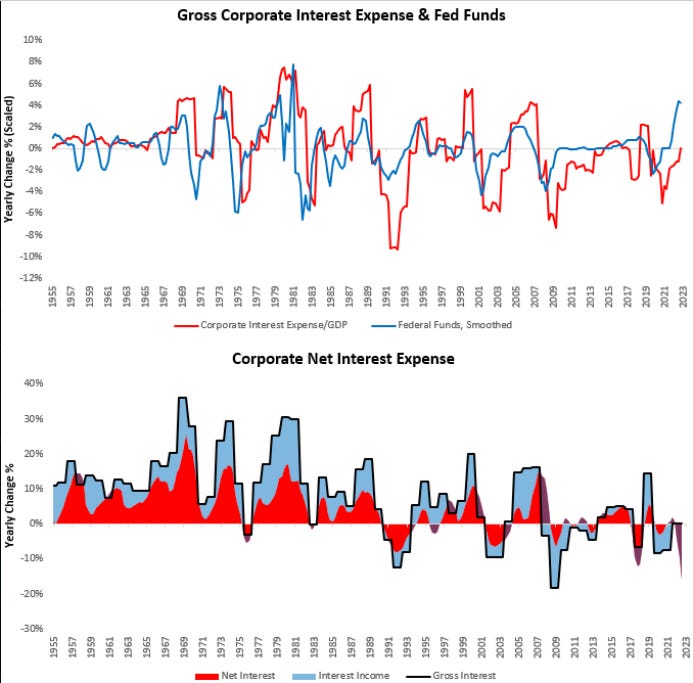
70 years of data and trends are not something you mess with and each and every thay the Federal Funds rate has risen, the corporate net interest expense has exceeded it on a year over year basis. So this margin compression is coming and it will destroy an already fragile landscape that sees the majority of corporations being miraculously pulled higher by the large MEGACAPs that act like a vacuum for all investment alpha chasers out there. All of this coming just in time for Non Farm Payrolls to print their first negative number in years:
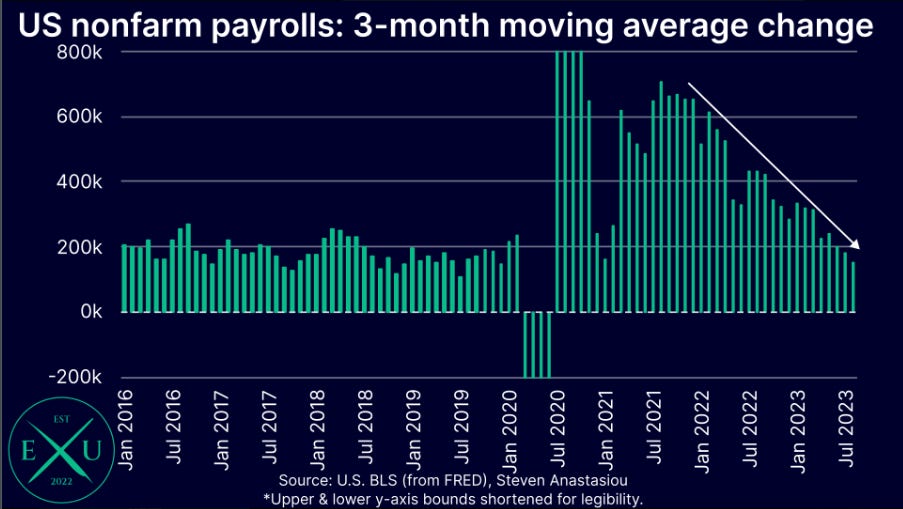
This downward 3 month average change is also an obvious one, you know what’s coming dear Magnelibra readers, something we have been waiting for to usher in the new regime change out of the fine FRB down there on Constitution Avenue.
Our last charts show another end to an economic bubble and this one has to do with China. We keep hearing how they are selling off their US Treasuries…well that is indeed the case, but rest assure they aren’t doing so because they want too, they are doing so because they have to. Now there is a very big difference there obviously and in order to defend the Yuan from sinking, well they have no choice:
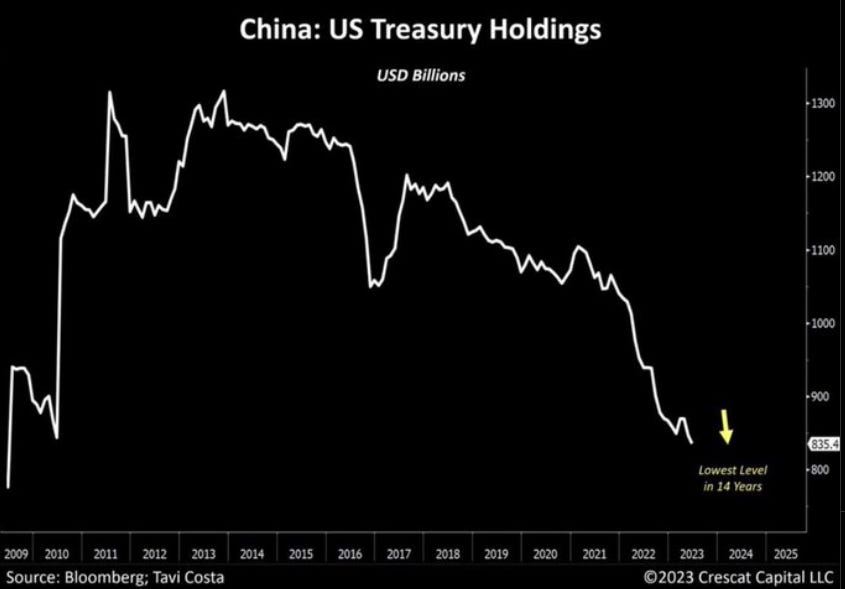
However what isn’t ever discussed is the fact that China is no longer our largest importing partner. Now this will have very profound effects well into the near and longer term future. Can the Chinese domestic economy pick up the slack…we doubt it, can China make in roads across the globe to make up for the loss of exports to the US, possibly, but this will all take time, something the PBOC and the Premiere are probably short on:
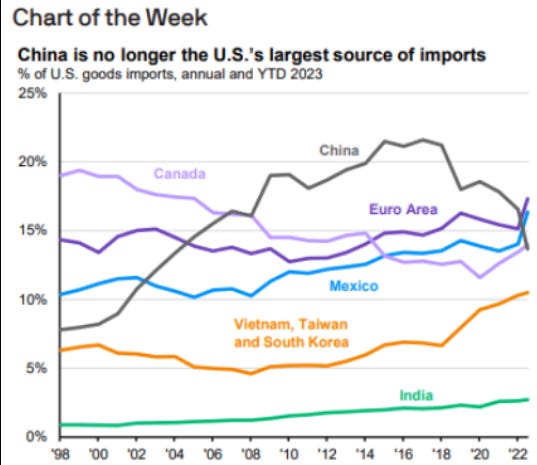
So as you can see this all makes sense in regards to the Chines having less US dollars and less need for US treasuries, but in reality, what has transpired also means there is a global shift going on and we have to take notice of these things!
Alright as far as last Friday’s Settlements the Nasdaq was a rare weak link and did settle below the all important 15550. That is our level in the sand for this week, long above, short below, we aren’t going to complicate that. Higher yields and stronger US Dollar continues to be ignored by equity players…for how long?
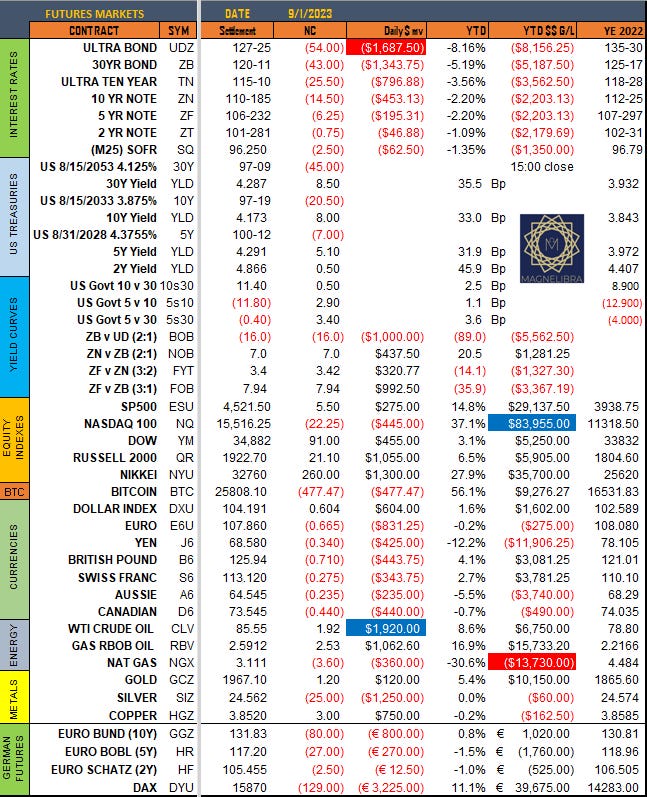
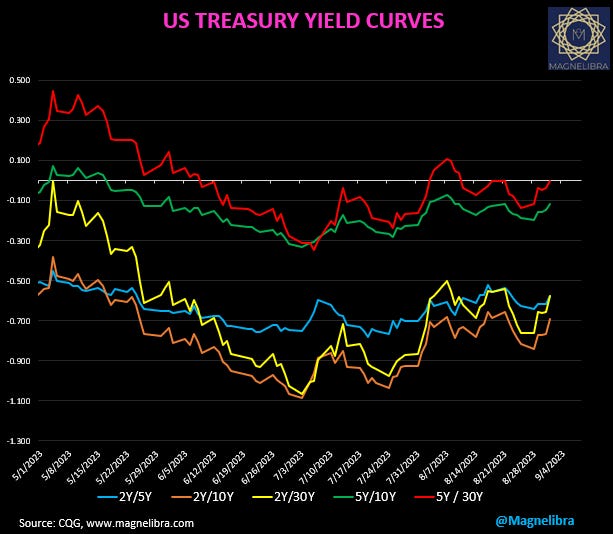
We continue to see the US curve steeper as the 2y was basically unchanged with the 10s and 30s + 8bp plus:
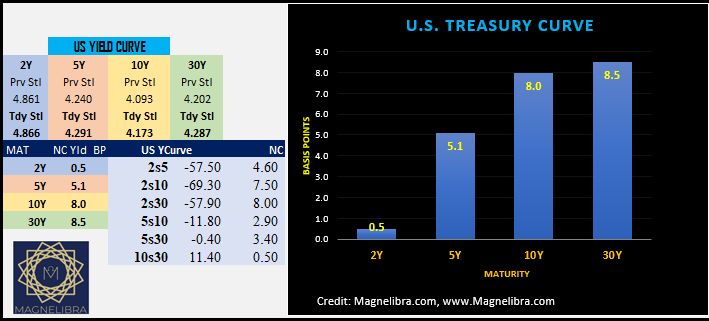
As far as this steeper trend we can see that the 5s30 is starting to push the zero threshold once again:
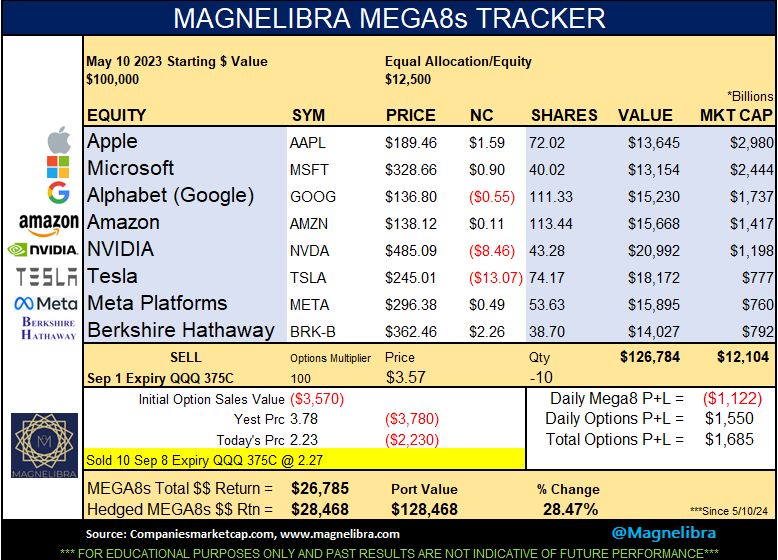
When we look at the MEGA8s it was a mixed bag with Tesla the weak link and we continue now to see our options hedged MEGA8 outperform, it is short the QQQ 379C this week, the tracker new sale shows 375C but it is the 379C @ 2.27. The Sept 8 Expiration 375C settled at 4.18 on 9/1. We apologize for the misprint there, the strike is off but the settle price of 2.27 is indeed the 379C:
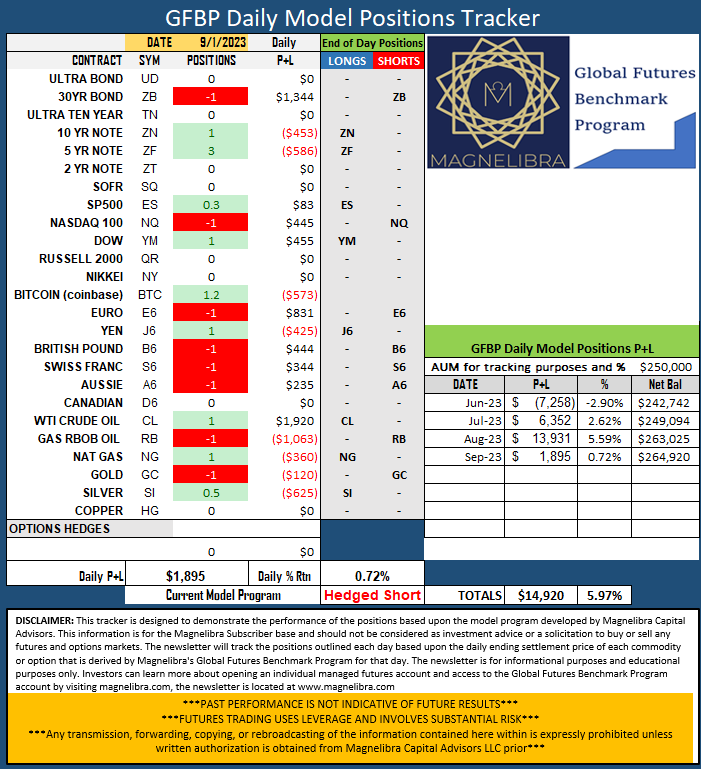
As far as our futures tracker and sentiment, no changes on Friday:
Ok one final note, we wanted to just put something out there, we keep hearing how our oceans are heating that everything is heating up…well long time Magnelibra readers know we are staunch Electro Magnetic Universe theory believers and being such, well we know that the Sun and Cosmic Rays control our variable climate. No we do not believe humans have any input, sorry. We know humans to be irrational and emotional when it comes to many topics, we aren’t going to be dissuaded on that argument so don’t try. When the main stream narrative pushes something, we always opt for the opposing viewpoint, it usually makes the most sense, why? Because the majority of the time, there are clearly other agendas at play and sorry, we dig, we research and we know where to look for facts. So with that said, let’s take a look at the Greenland Ice sheet shall we:
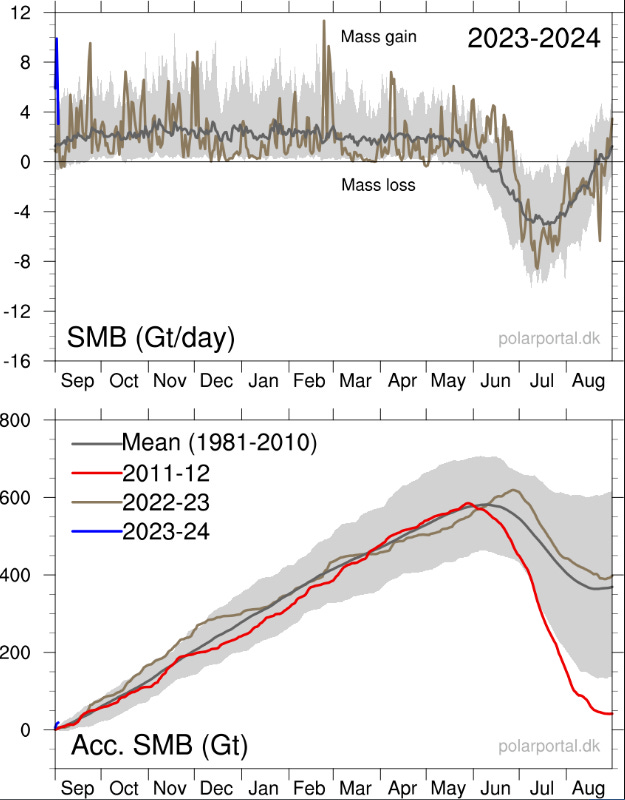
The start of the new season is a massive uptick in mass gain and the 2023-24 trajectory is clearly well above trend here. It is and has been well above the 2011-12 low points and above the 40Y decadal averages. This year is on pace already to beat last year which tracked the decadal average highs up thru December last year. So when the world is telling you everything is burning up…well not so much!
Ok please like, share, subscribe and try to support our work, as we say time and time again, information and education are the keys to intellectual growth, we hope we are doing our part to inspire and to inform.
DISCLAIMER: For educational purposes only. This is not a solicitation to buy or sell commodity futures or options. The risk of trading securities, futures and options can be substantial and is not for everyone. Such investments may not be appropriate for the recipient. The valuation of futures and options may fluctuate, and, as a result, clients may lose more than their original investment. Nothing contained in this message may be construed as an express or an implied promise, guarantee or implication by, of, or from the author Michael Agne owner of Magnelibra Capital Advisors. Magnelibra the CTA and its Global Futures Benchmark Program may hold long and or short positions in the various futures and markets that Magnelibra covers. We will never claim that you will profit or that losses can or will be limited in any manner whatsoever. Past performance is not necessarily indicative of future results. Although care has been taken to assure the accuracy, completeness and reliability of the information contained herein, we make no warranty, express or implied, or assume any legal liability or responsibility for the accuracy, completeness, reliability or usefulness of any information, product, service or process disclosed.