


The Wall Street weekend edition came with a great piece entitled “Trading Places.” The tag line under the title was this, “Wall Street used to have a strict hierarchy: Traders made money and won glory while programmers wrote code and stayed out of sight. Now, the line between the jocks and the nerds is disappearing.” The article focused upon details from Adam Korn, a 16-year veteran at Goldman. He stated that success today depends less on trusting one’s gut, rather much of a trader’s job is embedded in the computer code or algorithms, which do much of the work now. I mention this article because it strikes at the heart of what we do, trading and investing and people are often coerced by fancy technological jargon, like “Algorithms.” What is an algorithm in simple terms, nothing more than a set of rules, if this, then that. Money has seemingly lost its mind and is being tossed at anything deemed, “fintech.”
What is the real story though, what has all this computerized algorithmic trading truly done, how much value has it truly created? One question I would like to ask, is there a correlation between the explosion of our debt levels and this newly digitized financial age? Are we creating more and more debt/money to toss at these computerized games, to only find out they are nothing more than gigantic pyramid schemes? Think about all the derivatives that have been created, where did they come from? Quants, that’s where and truly what has all this financialization led to? Massive amounts of debt and massive amounts of income disparity, that’s how I see it. In the trading world the outcome is certainly obvious, the elimination of real markets, one which exists to bring end users and speculators together. The financial markets are dominated by decimal increasing bid and offering speed pushers, churning faster than the Wolf of Wall Street could have ever imagined. Whether Wall Street admits it or not, a trading algorithm is only as good as the guy programming it, call that guy what you want, quant, PHD engineer, data scientist, it really doesn’t matter, in the end, he is just another trader and you have to decide, how much capital you are willing to let him risk.
The WSJ reported last week that nonrural fixed-asset investment in China has plunged to just 5% down from over 30% in 2010, adding to the already myriad of internal problems China is facing. So, they are taking it on the chin domestically as well as internationally as the trade fight with the U.S. continues to accelerate their already slowing economy. It’s not all bad however on the Chinese front, despite Tencent’s earnings hampering markets a week back, Tencent’s Chief Strategy Officer James Mitchell said the company expects to continue to push into the eSports arena, which the company already generates nearly half its total revenue from, some $18 billion. For those that haven’t heard of eSports or League of Legends, you soon will, the League of Legends Mid-season Invitational draws more viewership than the NFL’s Super Bowl. So, it’s safe to say it’s a gigantic market and Tencent is one of Asia’s largest player in the games business.
Moving to the equity markets and putting all the recent moves into perspective. The bull market reached a new crescendo today as the SP500 became the longest bull market equity run ever. In total there have been some 3,454 days since the SP posted that 666 low on March 9th 2009 besting the run from 1990 to 2000. Well we all know how that ended right? So, among all the continued kool-aid drinking we have a few charts for our readers. This first chart is a means to a stock market end, yes, I know it’s a bit Kantian, but being he is one of my favorite philosophers, second to Jung of course, but anyway this US treasury 2year vs 10year chart should start to alarm some of you long term equity bulls and sorry for the Dirty Harry reference, but it seemed apropos:
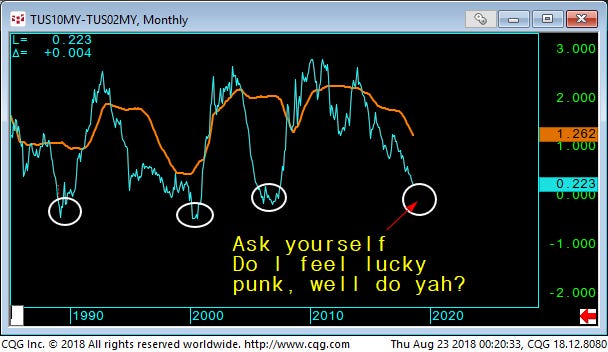
Look, we don’t think correlation is necessary causation, but hey, this chart does paint an obvious case. For those less inclined to the quant side of things, well a whole slew of data can be put forth as to inverted curves and recessions, but we like the visuals and all this chart tells us is that the more credit tightens, i.e. the more expensive debt gets, the harder it is to finance, just about everything. With that, the margin bets, the leveraged bets if not met with higher corresponding asset prices, well then collapse as you are faced with negative returns and if your credit line dwindles, well then, the selling commences. It’s not rocket science, it’s purely math and tolerance.
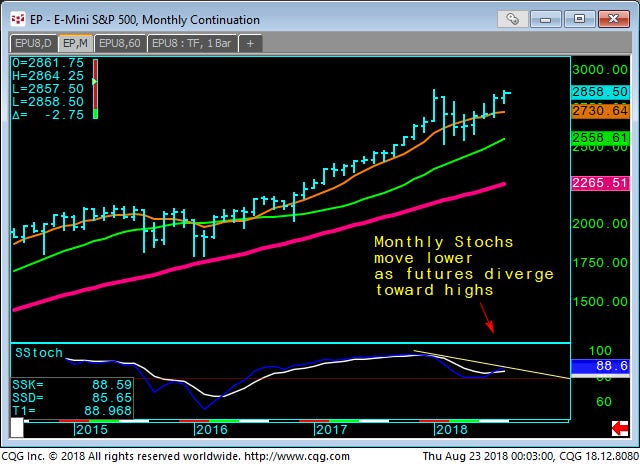
Ok here is a monthly chart of the SP500, notice the diverging stochastics, moving lower as the price tries to attack the high:
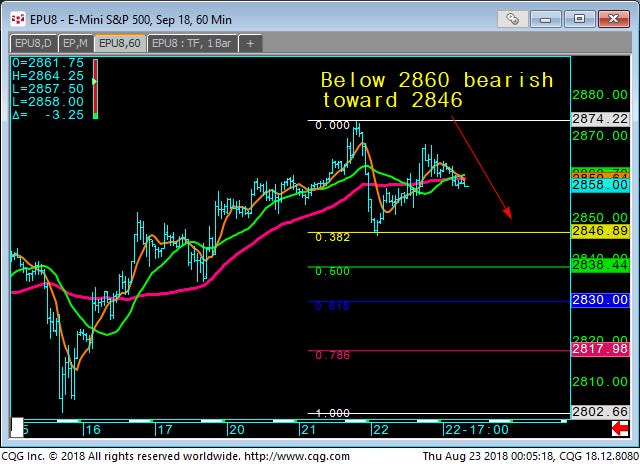
When we look at the 60-minute chart of the SP500 2860 seems to be key to continued upside, but below would rotate down to the first support @2846:
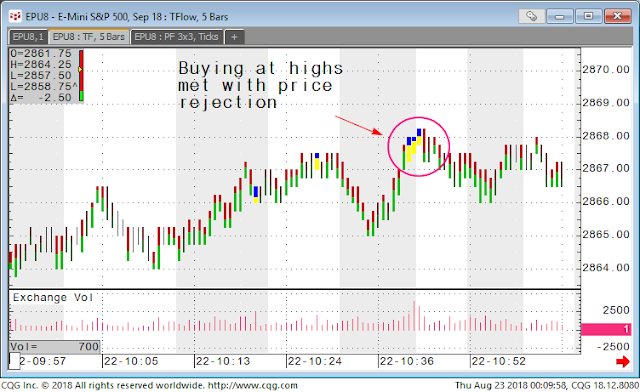
The SP500 CQG Tflow chart shows some decent buying being rejected up at 2868:
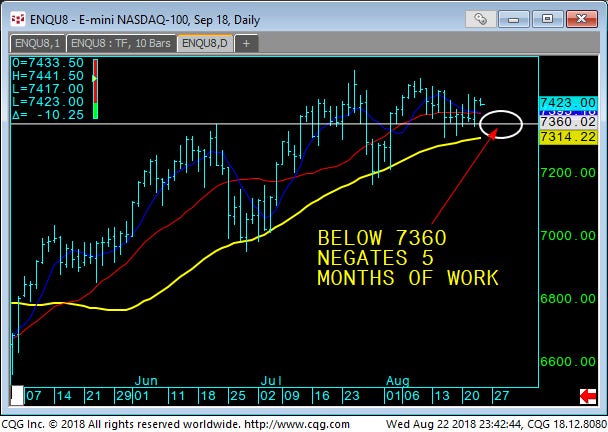
The NASDAQ has reluctantly been able to stay above the 7360 level on the daily charts. Despite the tech sector being the investors sector of love, we feel this level will usher in a rotation once taken out and in order for the bull move to continue this level needs to be defended:
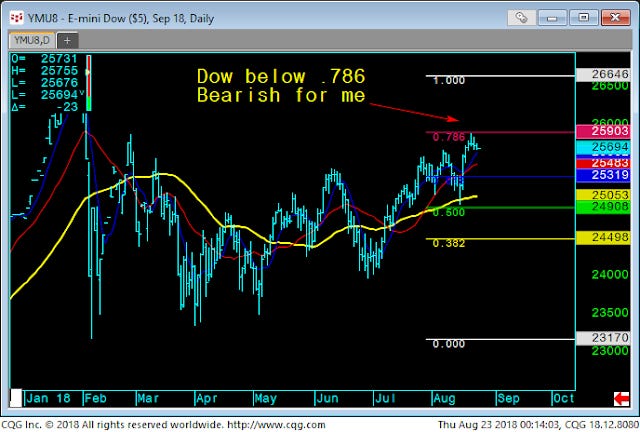
The Dow futures daily chart has been stymied by the .786 our favorite indicator and this rejection is very telling, bulls can you get it back above? If not, risk will be tested:
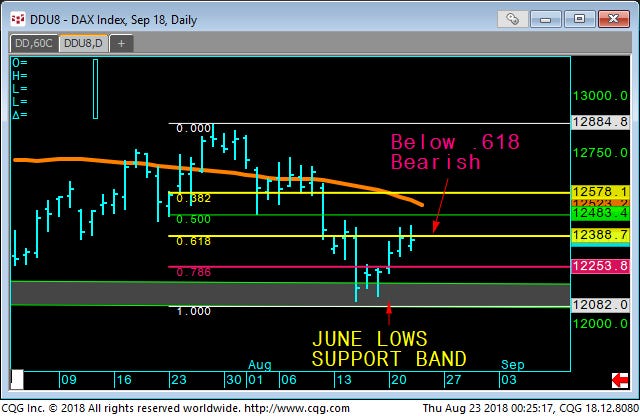
The DAX bounced off of the June lows and carried what we believe the rest of the global markets but the Fib .618 has capped this rally for now and 12523 Vwap provides further resistance above:
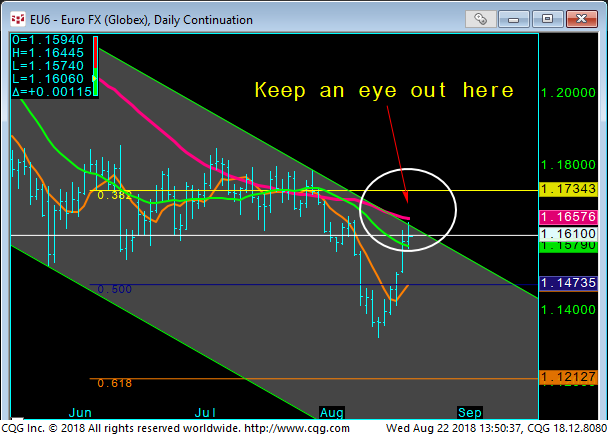
The Euro currency has put in a nice dead cat bounce and the technical rebound is being thwarted by both the trend channel as well as the 50-day moving average:
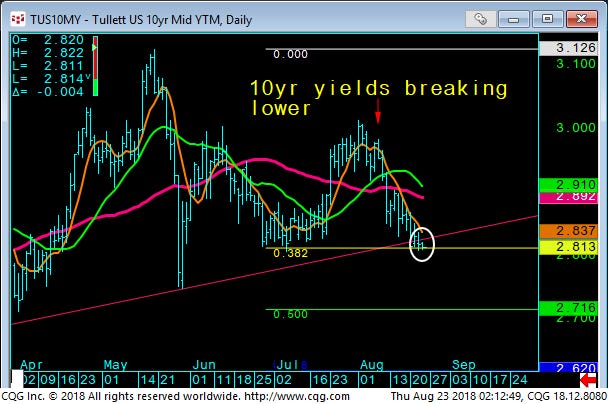
Just to show you the pressure is increasing, we have that pesky US 10yr treasury yield plunging again, what will the FED do? 10-year yields are down some 31 basis points or 10% from their mid-May highs:
DISCLAIMER: For Educational purposes only. This is not a solicitation to buy or sell commodity futures or options on neither commodity futures nor an endorsement for the purchase and sale of an ICO, Cryptocurrency or any digital asset and should not be construed as such. The risk of trading securities, futures and options can be substantial and is not for everyone. Such investments may not be appropriate for the recipient. The valuation of futures and options may fluctuate, and, as a result, clients may lose more than their original investment. Nothing contained in this message may be construed as an express or an implied promise, guarantee or implication by, of, or from the author Mike Agne owner of Magnelibra Capital Advisors LLC (MCA) and the website blog, which can be found at www.econemotions.com. All rights are reserved and encompass MCA and The Crypto Corner Newsletter, we will never claim that you will profit or that losses can or will be limited in any manner whatsoever. The Crypto Corner logo and name is the sole right and property of (MCA). Past performance is not necessarily indicative of future results. Although care has been taken to assure the accuracy, completeness and reliability of the information contained herein, (MCA) makes no warranty, express or implied, or assumes any legal liability or responsibility for the accuracy, completeness, reliability or usefulness of any information, product, service or process disclosed.
DO NOT COPY OR FORWARD INTELLECTUAL PROPERTY WITHOUT PRIOR WRITTEN CONSENT AND OR APPROVAL