
The Negative Convexity We Flagged Is Now a Cash Flow Problem
We walk through the mechanism we flagged months ago, now showing up in the filings.

***DONT FOLLOW THE MAINSTREAM SUBSCRIBE TO MAGNELIBRA IF YOU REALLY WANT TO UNDERSTAND WHERE THE MARKETS ARE HEADED***
***DONT FOLLOW THE MAINSTREAM SUBSCRIBE TO MAGNELIBRA IF YOU REALLY WANT TO UNDERSTAND WHERE THE MARKETS ARE HEADED***
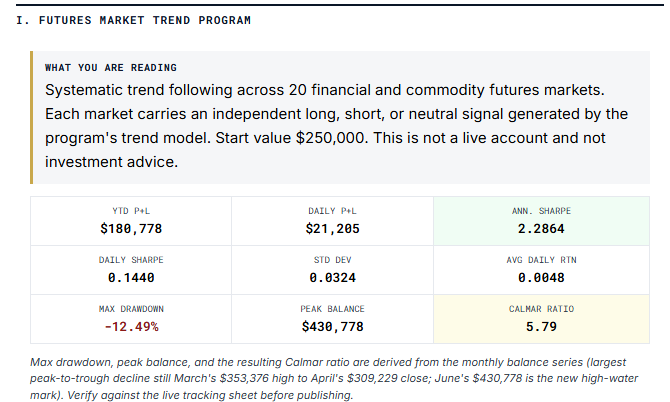
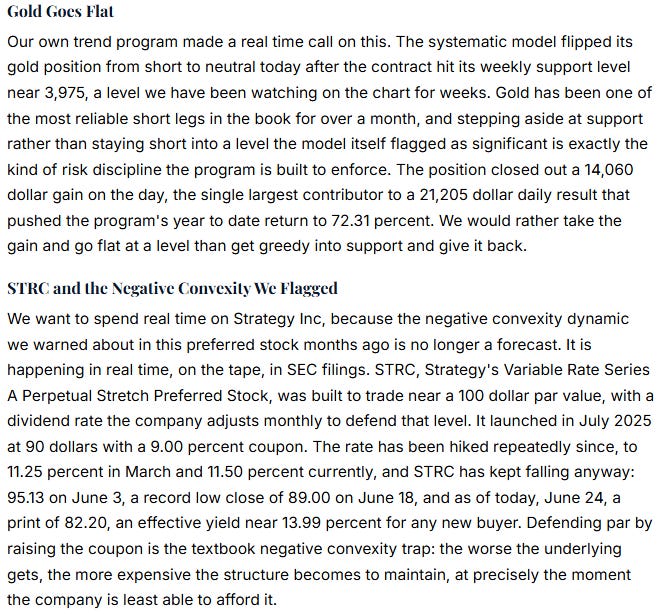
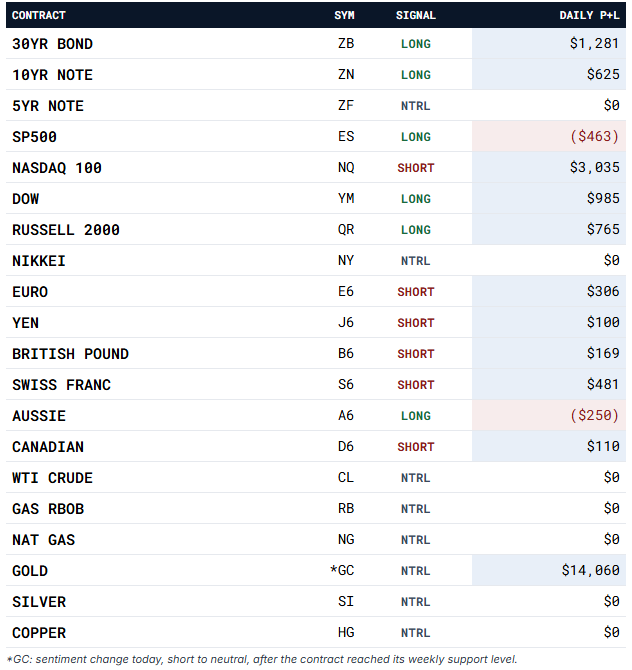
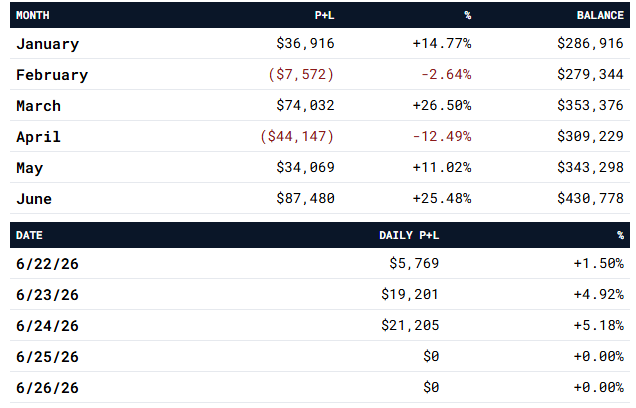
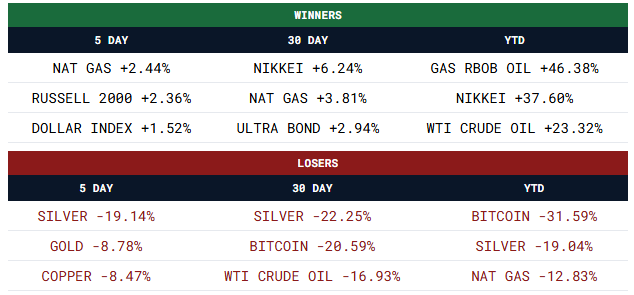
June is now up 25.48 percent with two trading days left to report, comfortably the best month of the year and pushing the program to a 72.31 percent year to date return. The short Nasdaq leg has been the standout this week, up $3,035 today alone, while the long bond sleeve, thirty year and ten year both long, is finally getting paid as yields fall instead of fight the position. Gold's flip to neutral leaves the program with zero outright commodity exposure for the first time in over a month, all of the remaining risk concentrated in rates, equity index futures, and currencies.
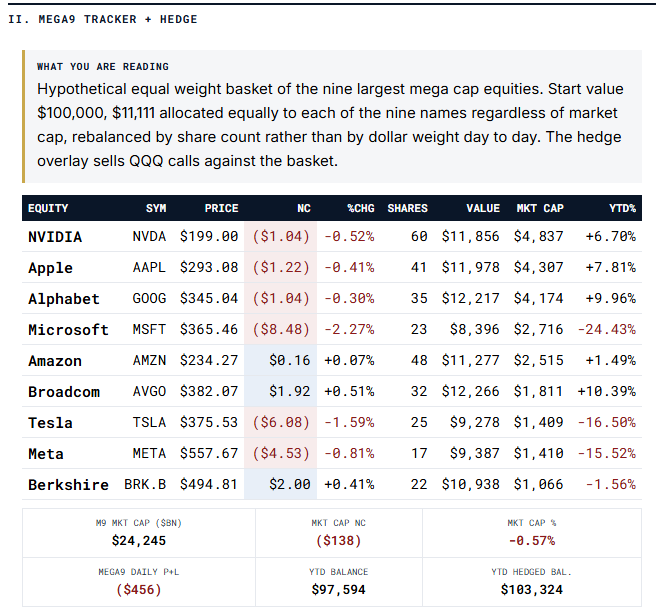
A much quieter day for the basket than the broader market, down just $456, 0.47 percent, while the equity futures and metals complex took far bigger hits elsewhere in this edition. Microsoft remains the deepest laggard at negative 24.43 percent year to date, with Tesla and Meta both still down double digits. Broadcom and Alphabet continue to anchor the basket’s gains, up 10.39 and 9.96 percent. The hedge overlay’s year to date edge over the unhedged tracker held steady at 5,730 dollars, a 5.87 percentage point spread.
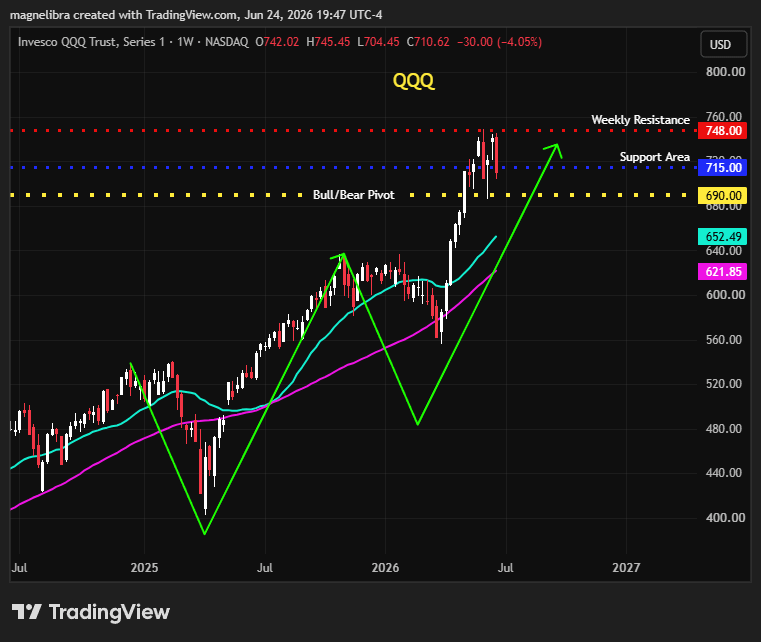
QQQ broke harder than the basket itself, down 4.05 percent on the week to 710.62, slipping through the 715 support area we have been tracking and now testing the gap up toward 748 resistance from below rather than from above. The 725 put we have been working to buy at 3.00 since Monday is far away and short calls would have performed but you can’t catch everything!
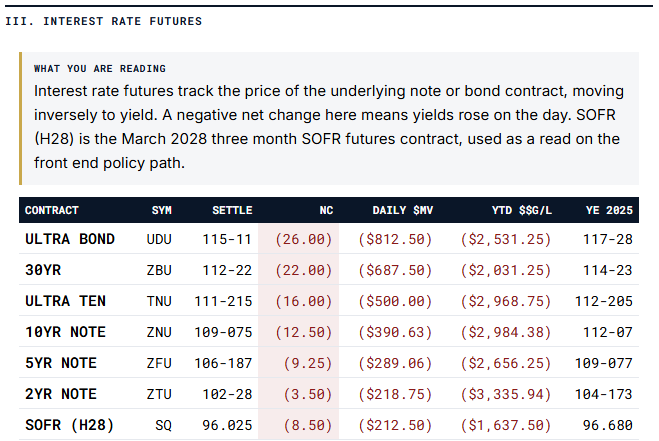
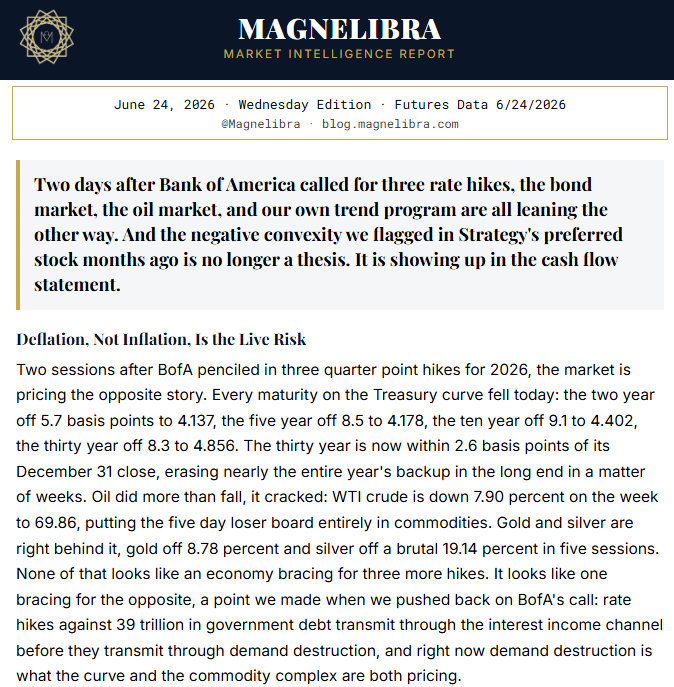
Every maturity rallied today, a full reversal from last edition's broad selloff. The Ultra Bond contract gained 51 ticks, its best single session in weeks, though it remains down $812.50 per contract year to date. The long end is now pricing the disinflation case the short end has been slower to follow, consistent with the curve flattening detail in the section below.
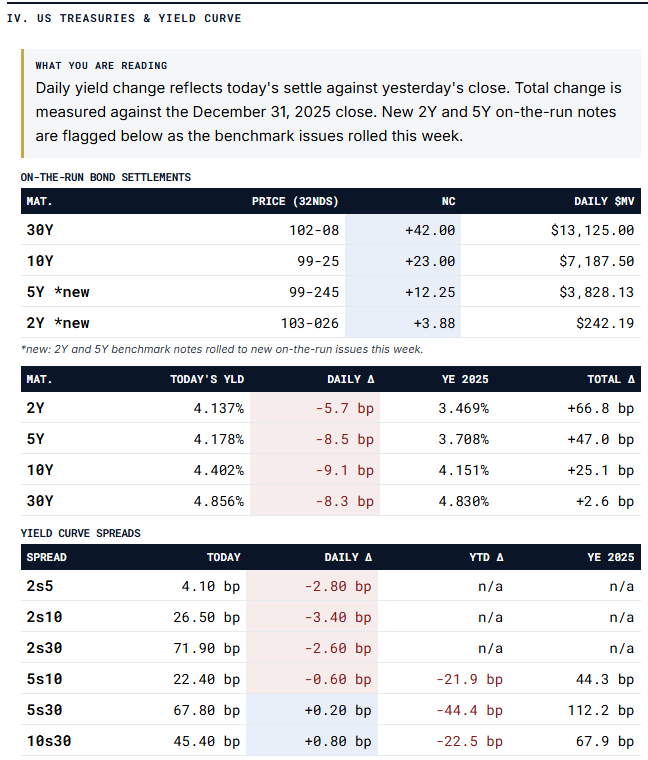
The long end has nearly round tripped to where it started the year: the thirty year is just 2.6 basis points above its December 31 close, while the two year remains 66.8 basis points above its own. That gap is the curve telling a growth story, not an inflation one. The belly is leading the rally, five and ten year yields both down more than 8.5 basis points today, more than either end of the curve.
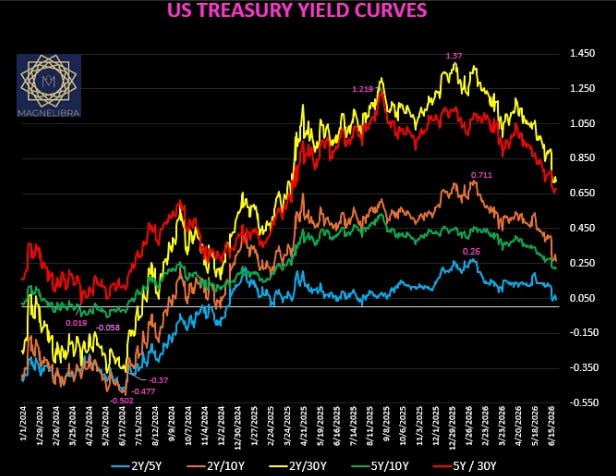
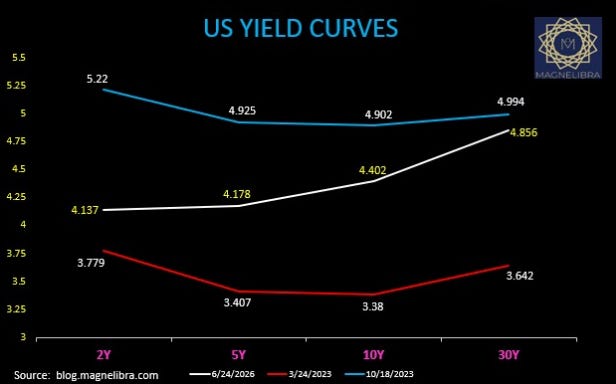
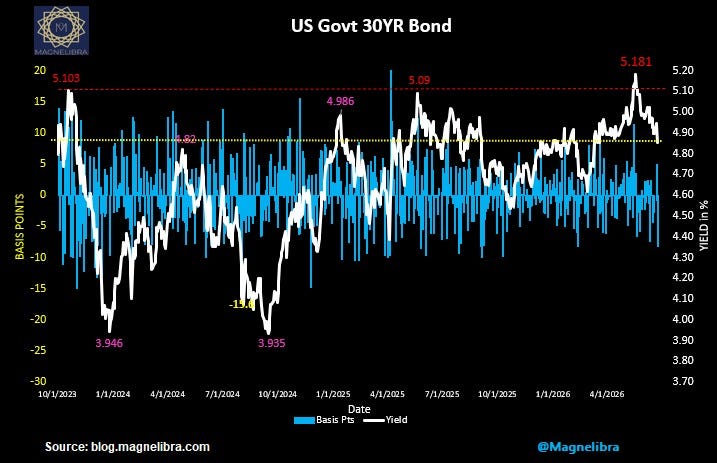
The thirty year bond has round tripped from a 5.181 high earlier this cycle back to 4.856 today, a level it last visited consistently in the second half of last year.
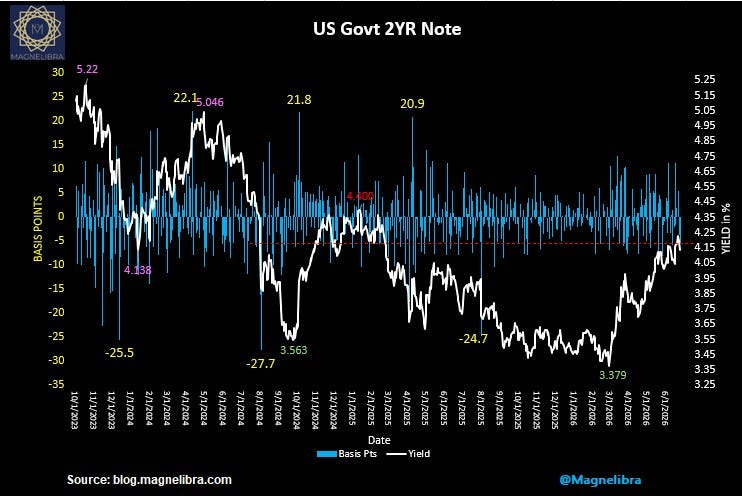
The two year, the maturity most sensitive to the Fed's own policy rate, remains the front end's holdout: still well above its 3.379 cycle low even after today's decline. However this could rapidly fall and price out all the expected hikes, faster than many believe, but you guys know this has always been our base case:
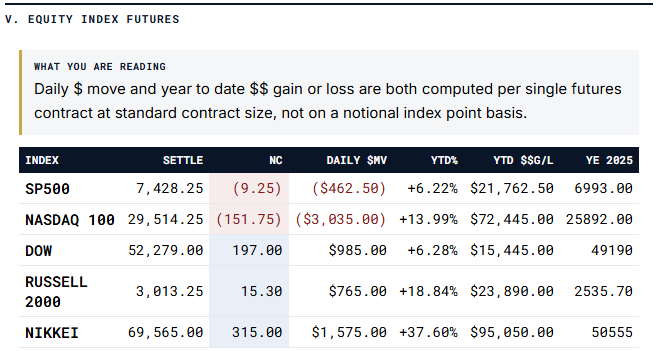
Nasdaq futures lost another 151.75 points to 29,514.25, the contract's worst single session net change of the week and a $3,035 per contract loss, exactly the move our short Nasdaq position in the trend program is designed to capture. Every index here remains comfortably positive year to date, Nikkei still the standout at 37.60 percent, but today's tape was a risk off session across the board.
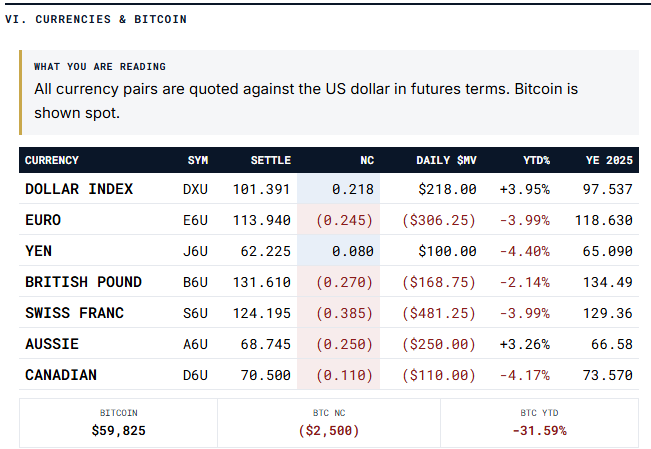
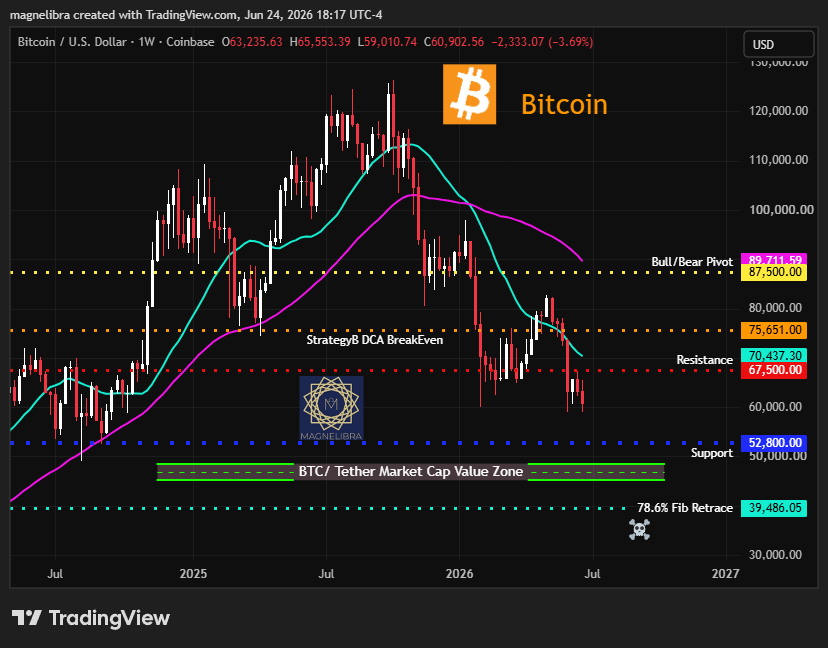
The dollar index continues to grind higher, up 0.22 on the day and 3.95 percent year to date, a dollar bid that is itself consistent with the deflation read rather than the hike read: a hawkish Fed story usually comes with a stronger dollar too, but a stronger dollar into falling yields and falling commodities looks more like a flight to quality than a rate differential trade. Bitcoin fell another 2,500 to 59,825, down 31.59 percent year to date and now trading at a discount to Strategy Inc's own 75,651 average cost basis of more than 20 percent.
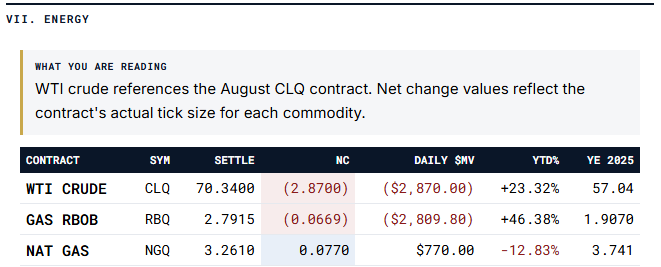
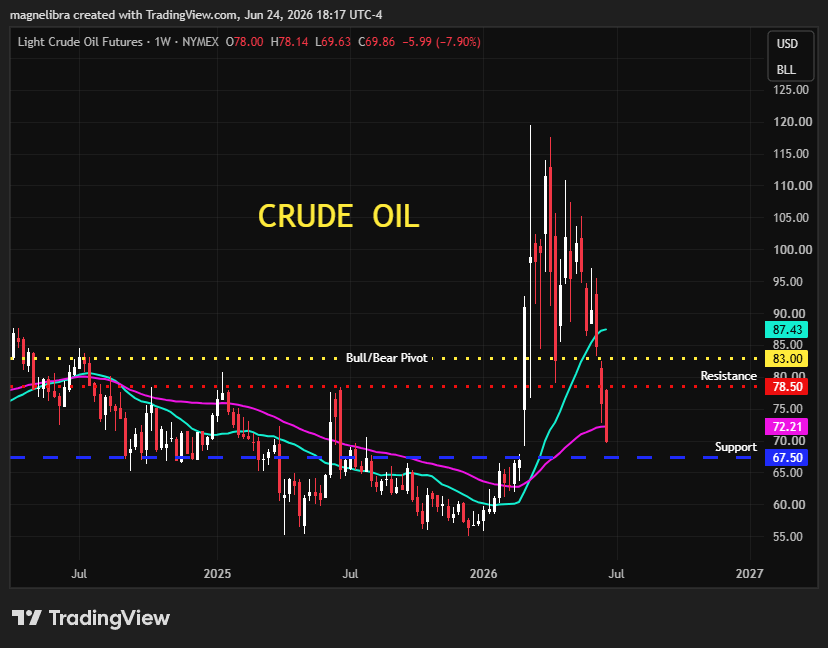
WTI crude is down 7.90 percent on the week per the weekly chart below, the single sharpest energy reversal on the board, and is now the worst 30 day performer across every market we track, down 16.93 percent over that window after being one of the best YTD performers as recently as last edition. RBOB gas is following it lower, down $2,809.80 today, though both remain solidly positive on the year. This is the kind of demand-side break that shows up in oil before it shows up anywhere else.
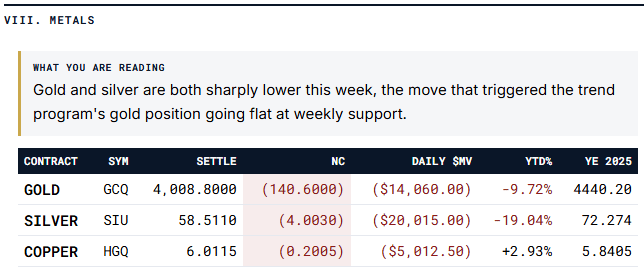
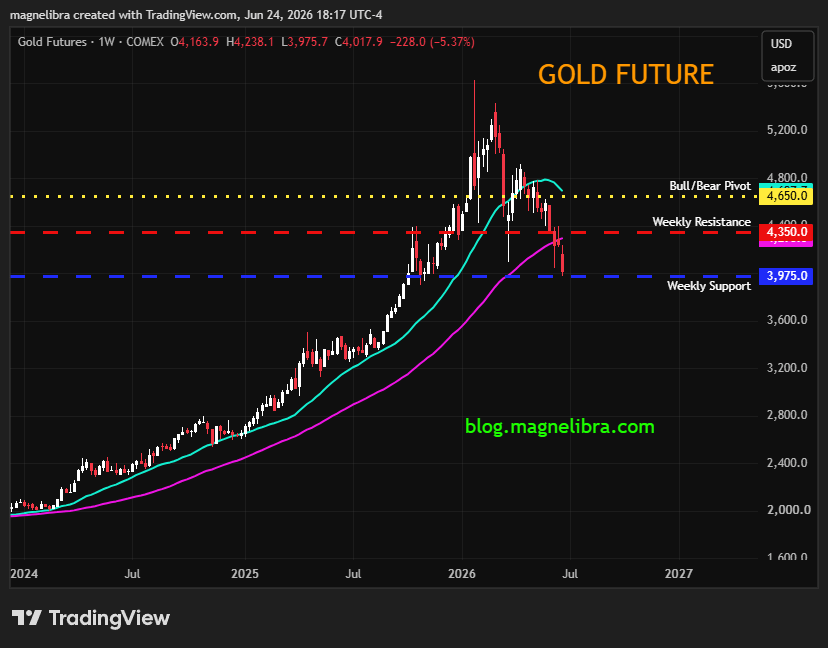
Gold lost $14,060 per contract today, by far its sharpest single session decline of the year, and the contract is now down 9.72 percent year to date after touching its weekly support level near 3,975 on the chart below. Silver is the far bigger casualty, down 19.04 percent year to date and off 19.14 percent in just the last five sessions, the single worst five day performer of any market we track this edition. Copper remains the one metal holding a gain on the year.
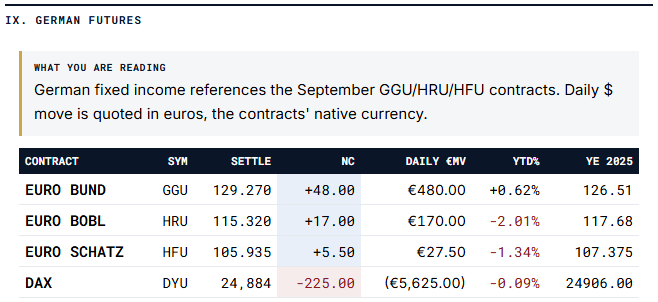
German rates are catching the same bid as US Treasuries, the Bund up 48 ticks and the Schatz up 5.50, both consistent with the global growth scare rather than a region specific story. The DAX is the lone decliner in this group, down a modest 225 points and essentially flat on the year at -0.09 percent.
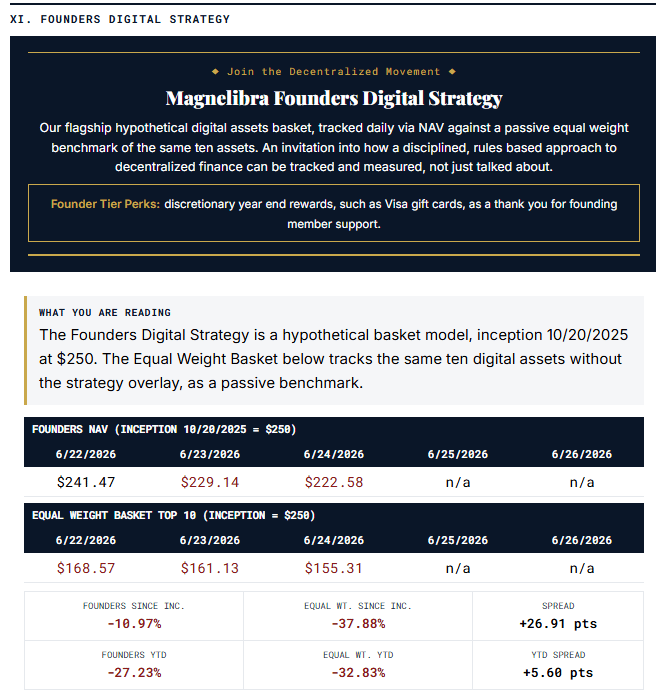
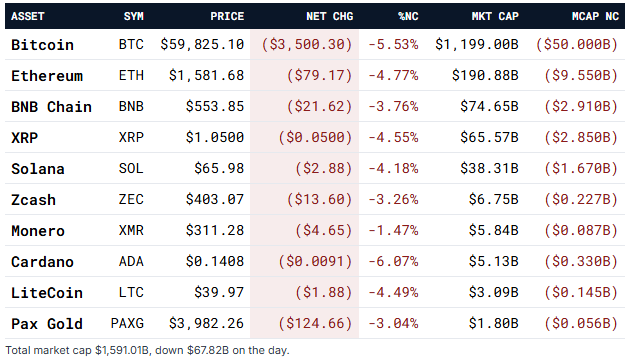
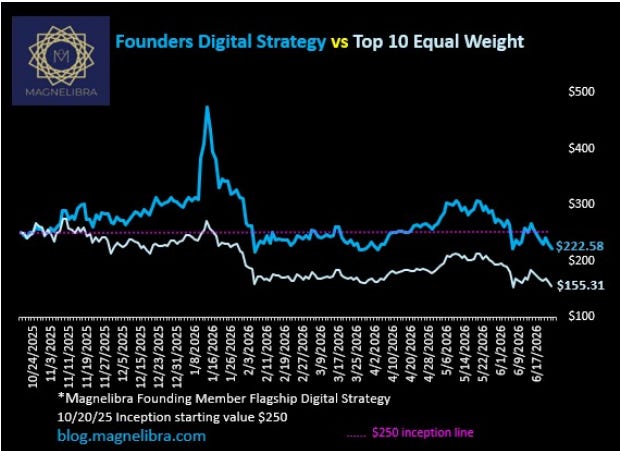
The digital asset basket is down across the board today, every one of the ten names lower, led by Cardano's 6.07 percent decline and Bitcoin's own 5.53 percent drop to 59,825.10. The Founders strategy NAV has now fallen three straight sessions, 241.47 to 229.14 to 222.58, down 10.97 percent since inception, though that still compares favorably to the passive equal weight basket's 37.88 percent since inception loss, a 26.91 point gap that has only widened as this drawdown has deepened.
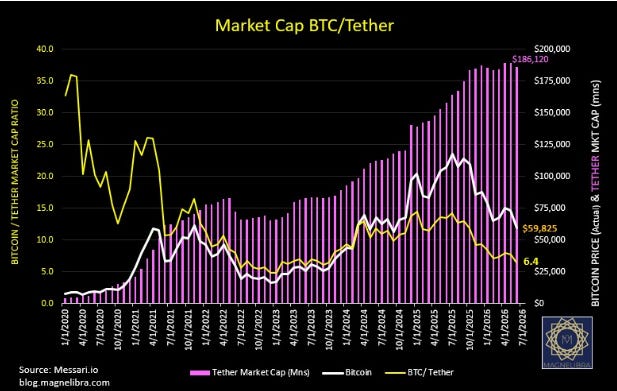
The Bitcoin to Tether market cap ratio has compressed further to 6.4, extending its multi year decline from above 35 in 2020. Tether's own market cap remains near 186.12 billion even as Bitcoin keeps falling, underscoring the same point from our last edition: stablecoin issuance has decoupled from the price of the asset it is most commonly used to trade.
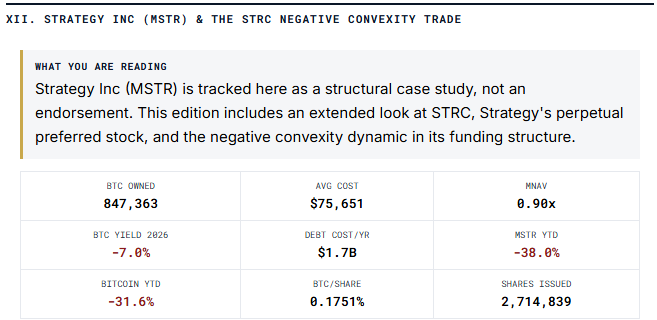
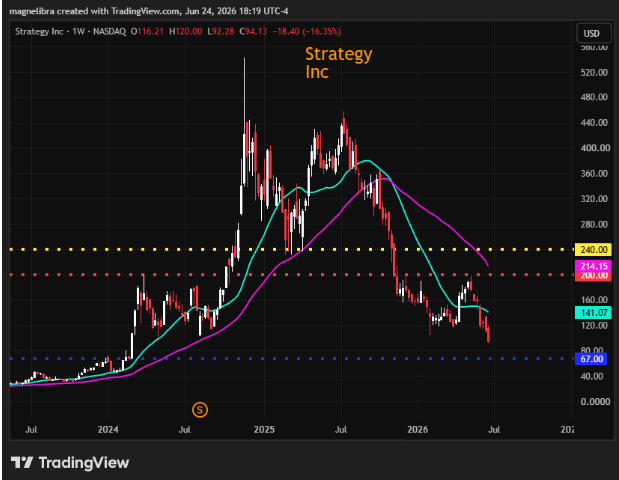
MSTR common stock fell 16.35 percent on the week to 94.13, an eight month low and a level last seen before the bulk of the company's 2025 bitcoin accumulation. Since STRC launched in July 2025, when MSTR traded near 455.90, the common stock is down roughly 78 percent against bitcoin's 43 percent decline over the same window, a reminder that the leverage embedded in Strategy's structure cuts in both directions, and is currently cutting against holders harder than spot bitcoin itself.
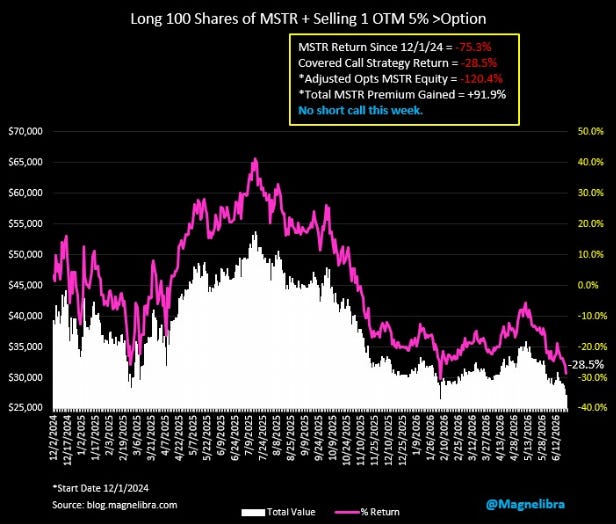
Strategy Inc's covered call overlay is sitting at a negative 28.5 percent return since the December 1, 2024 start date, versus negative 75.3 percent for the unhedged shares, total premium collected of 91.9 percent of the original position value since inception. There is no short call written this week: implied volatility and the speed of the underlying decline made a new short strike unattractive to put on.
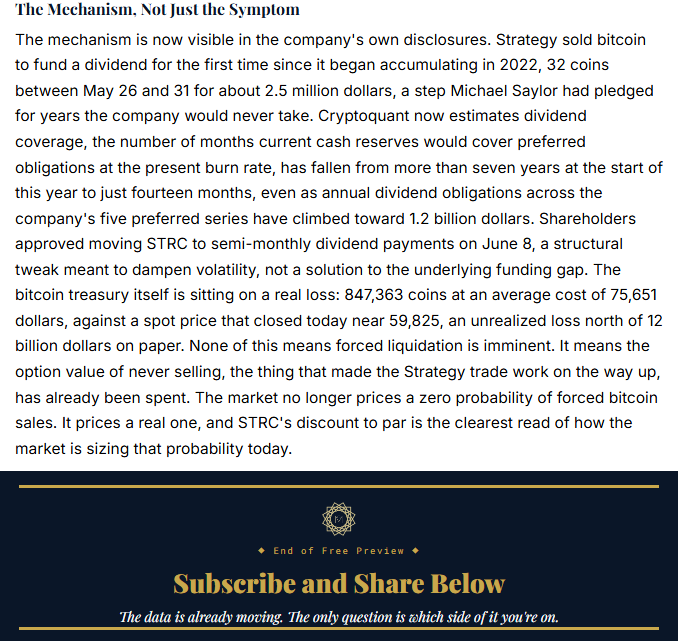
STRC, Strategy’s Variable Rate Series A Perpetual Stretch Preferred Stock, is the funding mechanism we have flagged as the structural weak point in this trade for months. It carries no maturity, no lien on the bitcoin treasury, and a dividend the board resets monthly with the explicit goal of holding the stock near its 100 dollar par value. That design is negatively convex by construction: when the underlying weakens, the coupon has to rise to defend par, which raises the cash cost of the structure at the exact moment the company’s ability to pay is most in question. STRC has traded straight through every line meant to hold it. It closed at a record low of 89.00 on June 18. It fell to 95.13 on June 3, the threshold under Strategy’s own framework that triggers a recommended 50 basis point dividend increase. As of today it is quoted near 82.20, an effective yield approaching 14 percent for any new buyer, even with the stated coupon still at 11.50 percent.
The mechanism we warned about is no longer theoretical. Strategy sold 32 bitcoin between May 26 and 31 for about 2.5 million dollars, its first net bitcoin disposal since it began accumulating in 2022, specifically to fund STRC distributions. Cryptoquant now estimates dividend coverage, the months of cash on hand relative to current preferred obligations, has collapsed from more than seven years at the start of 2026 to just fourteen months, as annual dividend costs across the company’s five preferred series climbed toward 1.2 billion dollars. The bitcoin treasury itself, 847,363 coins at an average cost of 75,651 dollars, is sitting on an unrealized loss above 12 billion dollars at today’s spot price near 59,825. Moving STRC to semi-monthly dividends, approved by shareholders June 8, may dampen the stock’s volatility. It does nothing to close the underlying funding gap. The question we raised months ago, whether Strategy would eventually be forced to choose between trimming the dividend and selling more bitcoin to fund it, has already been partially answered: it chose to start selling. The size of that selling, not the principle of it, is now the thing to watch.
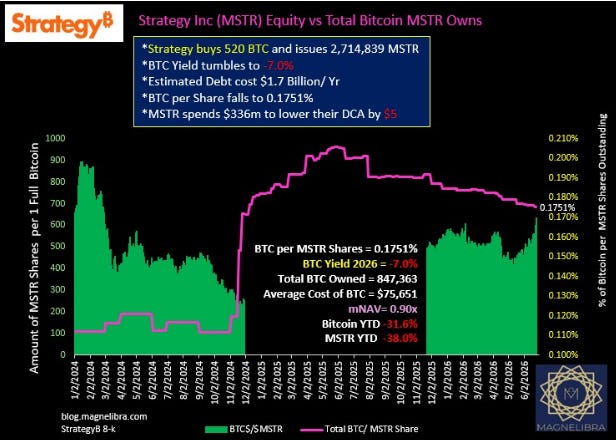

Did you guys see what has transpired with $MSTR and $STRC today? As we have warned for a year now, Strategy Inc. will suffer the fate of negative convexity and their levered fund which is truly what they are will be subject to greater market forces then they know how to handle.