As we count down the remaining weeks of summer, we hope you enjoyed a bit of a reprieve from these markets. We hope you found some time to break away and enjoy the weather, enjoy an outdoor activity and found that there is life outside of our digital screens and everyday ups and downs of our markets. We have the luxury of beautiful Lake Michigan here in Chicago and for those looking for some nice day trips, SW Michigan offers many an amenity as does Wisconsin to our north. We like to take a break during summer and head up to Lake Geneva and enjoy one of the hidden, well not so hidden anymore gems of the Midwest. This weekend was the annual Driehaus customer appreciation party which always offers some of the best fireworks of the season, sorry Richard, I let the cat out of the bag, but you do put on a nice display. Richard is founder and manager of Driehaus Capital Mgmt here in Chicago for those wondering. Hats off to his annual fireworks display as we enjoyed some never seen pyrotechnics, great work. It's always tough driving back to the concrete jungle but as our favorite fictional character Gordon Gekko (Wall Street 1987) always said, "Money never sleeps, pal!" So, despite the FOMC week, which presented nothing out of the ordinary, the markets seem to be stuck in an ever decreasing VIX and ever increasing deterioration of the global economic indicators. As we have said time and time again, this market is centrally bank driven and thus, truly nothing else matters. The only things that seem to matter are charts like this:
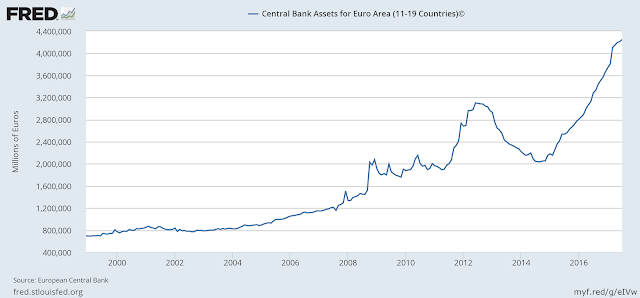
So despite our fine POTUS tweeting out Dow 22k and thus informally trying to take all the credit for it, this chart and the central banking cabal in general are the ones all investors should be thanking for providing such continued QE expansion. We wonder when the tide does turn who exactly the POTUS will be blaming, no doubt the DNC! Ok all politics aside and considering there isn't much to report on, let's look at a few key charts.
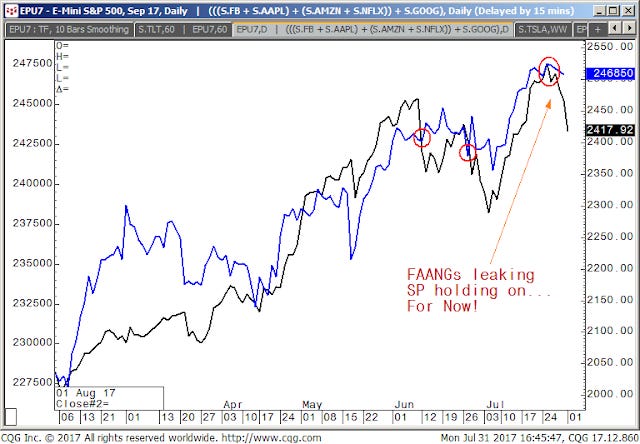
This first chart is an analog of the SP500 and the FAANGs. What it shows is that the FAANGs are seeing some turn over while the SP500 seems to be holding steady:
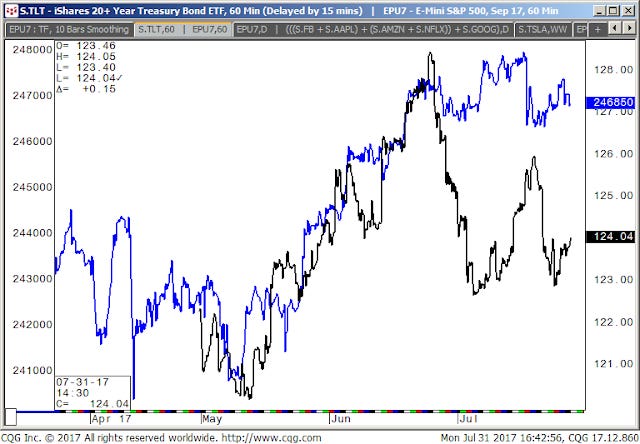
Our next analog chart shows the SP500 vs the TLT (20+yr ETF) the correlation broke down after the rate hike and now it seems we are waiting to see if we get a positive or negative correlation for the next move:
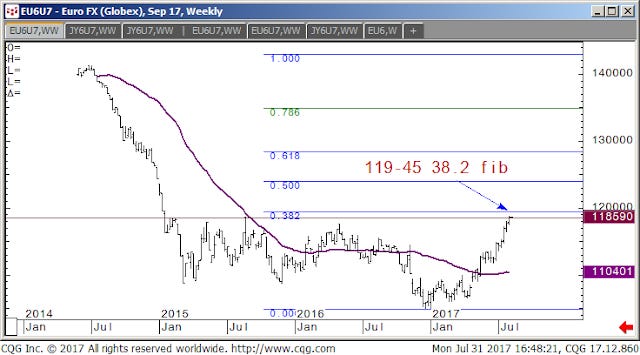
This last chart shows the Euro Currency which we have been watching since breaking the 113-00 level with further trend confirmation above 117-00 and now nearing 38.2% Fib retracement which should see whether this trend has any real sustainability, but we would think some would take some profits there and stall it a bit, but this chart is constructive to say the least:
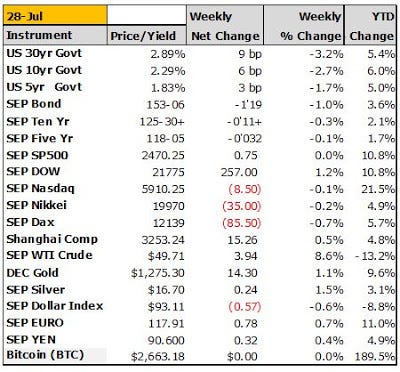
Ok so that's it, we aren't too keen on trying to force anything that's not there. Below are our weekly settles everything is up but the US Dollar and Crude, even Bitcoin has almost fully recovered to new highs, can we thank the central banks for that too? Of course! We know central banks are still highly accommodative, we know everyone is dumbfounded by the equity advance. We know everyone is looking for a top and calling bubbles and thus, everyone tries to shape the facts to their perceptions. Our perception is don't try to create news just because you have 24 hours in a day to cover, there's really nothing there of interest. Like all excellent traders know, when you try to force something, it usually goes the wrong way, so let's not force anything, rather let's enjoy the last few weeks of summer and find time to invest in one’s interests outside of work, sometimes not looking at things gives clarity to the things we constantly look at it, Cheers!