

Well the US budget should continue to deteriorate as the US Treasury released its quarterly funding announcement yesterday:
Treasury Announces Marketable Borrowing Estimates
October 30, 2023
During the October – December 2023 quarter, Treasury expects to borrow $776 billion in privately-held net marketable debt, assuming an end-of-December cash balance of $750 billion. The borrowing estimate is $76 billion lower than announced in July 2023, largely due to projections of higher receipts somewhat offset by higher outlays
During the January – March 2024 quarter, Treasury expects to borrow $816 billion in privately-held net marketable debt, assuming an end-of-March cash balance of $750 billion.
During the July – September 2023 quarter, Treasury borrowed $1.010 trillion in privately-held net marketable debt and ended the quarter with a cash balance of $657 billion. In July 2023, Treasury estimated borrowing of $1.007 trillion and assumed an end-of-September cash balance of $650 billion. The increase in privately-held net market borrowing was $3 billion: changes across all major components were small. (US Treasury Dept.)
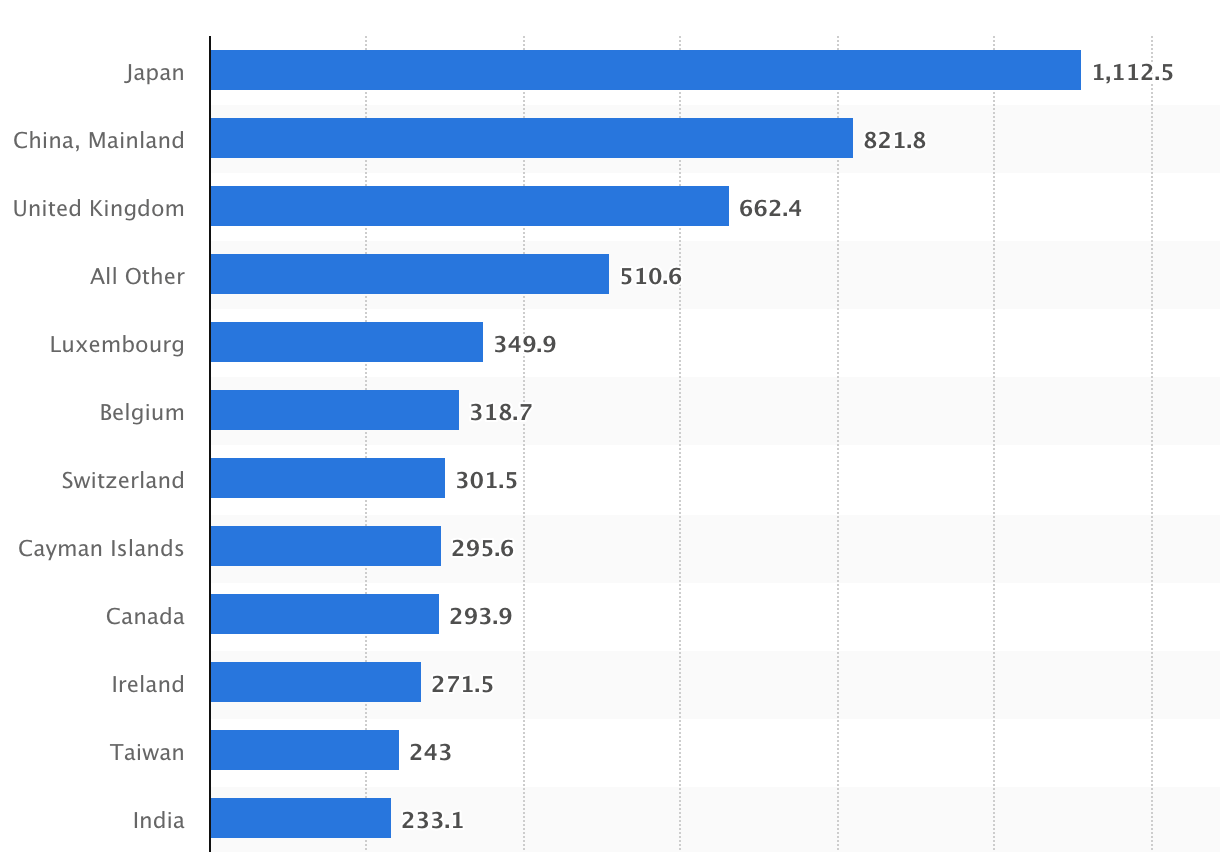
So with deficits and spending continue to rise we would expect the FRB to be handing the reigns over to say, the BOJ which yesterday also announced that it will allow the JGB 10Y yields to float higher. The BOJ policy release removed the explicit upper band ceiling to YCC, i.e. the 1% limit is gone. We felt this was inevitable as the BOJ can no longer hold the basketball underwater any longer. This is probably good news eventually for the ¥ and bad news for the Nikkei as they are inversely correlated, stronger ¥ = weaker Nikkei. This may not be good news for US equities or bonds either. Japan is the largest holder of US bonds and equities and it will be interesting to see if any of this is pared down:
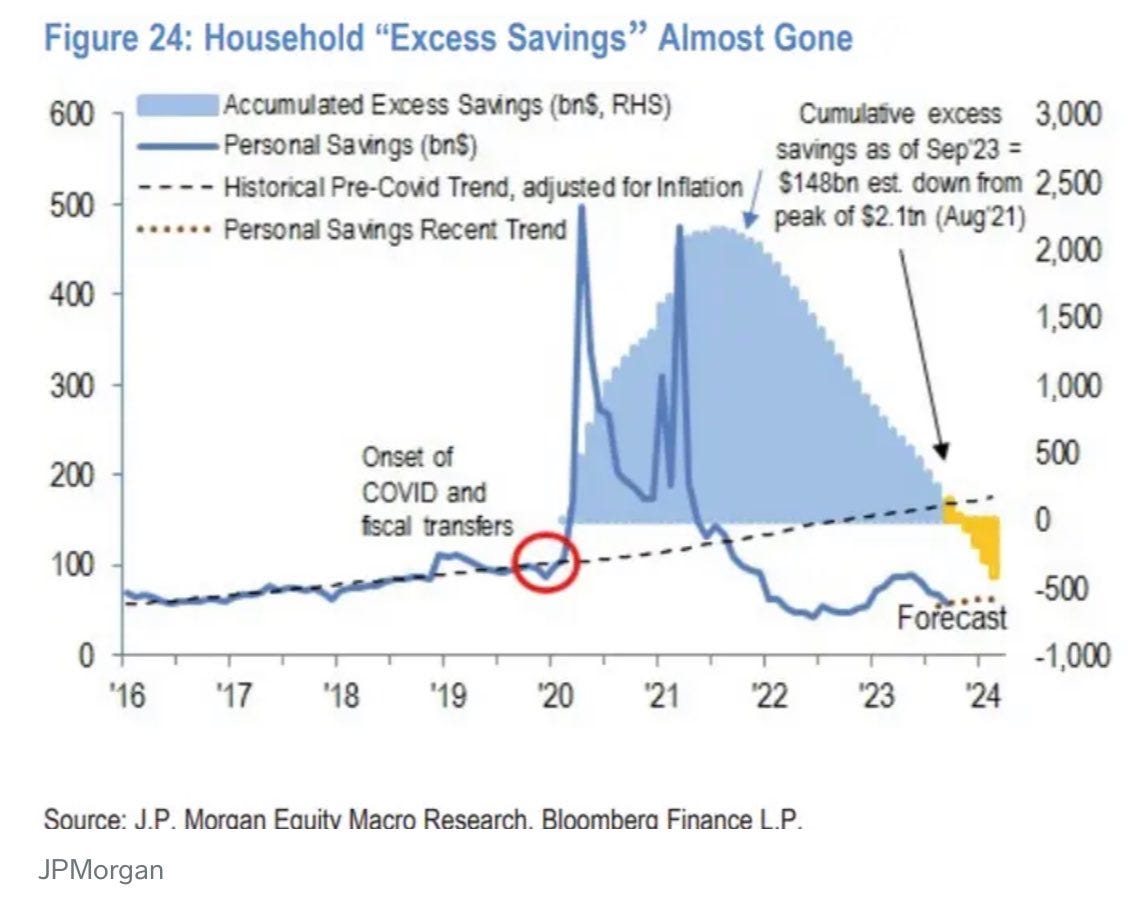
We also saw another alarming chart from JPM which shows the “excess savings” and the complete destruction of the post covid stimulus money. This is certainly bearish in regards to the ability for the consumer to withstand any major downturn and we have yet to see a negative non farm payroll print, but we know that the foundation has already crumbled and this data point doesn’t fit the no recession narrative:
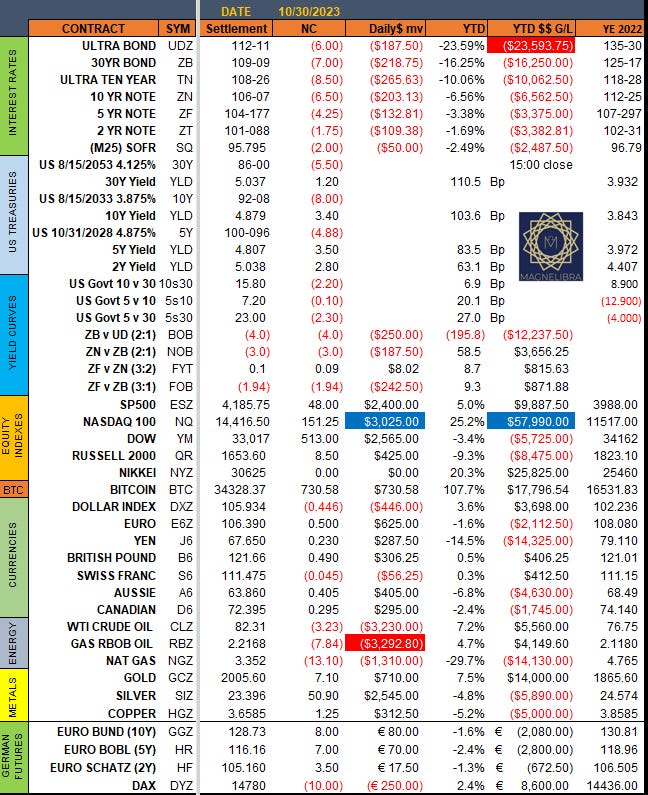
Ok let’s move onto the settlements from yesterday as we are closing out the month today and the equity charts will not look great on those monthly charts despite the bounce yesterday:
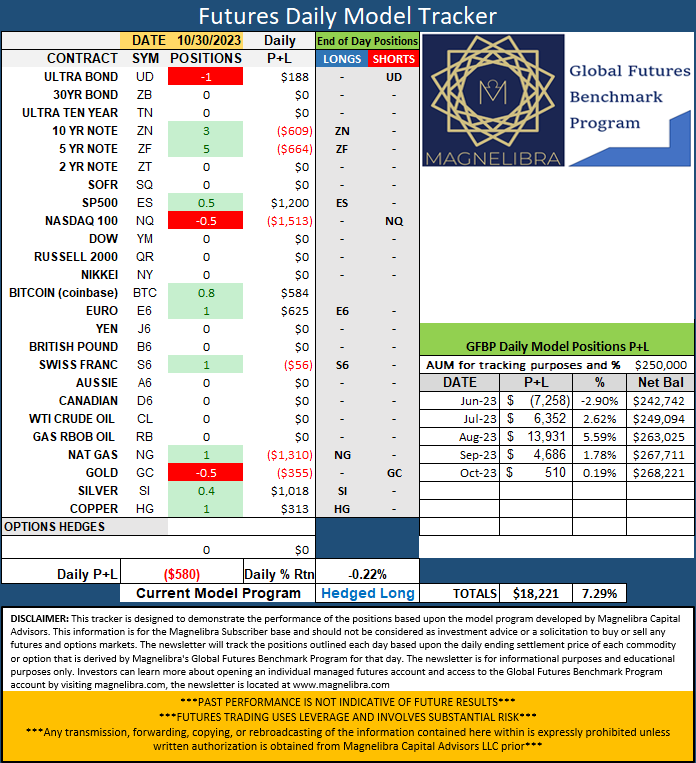
As far as the positions sentiment no changes:
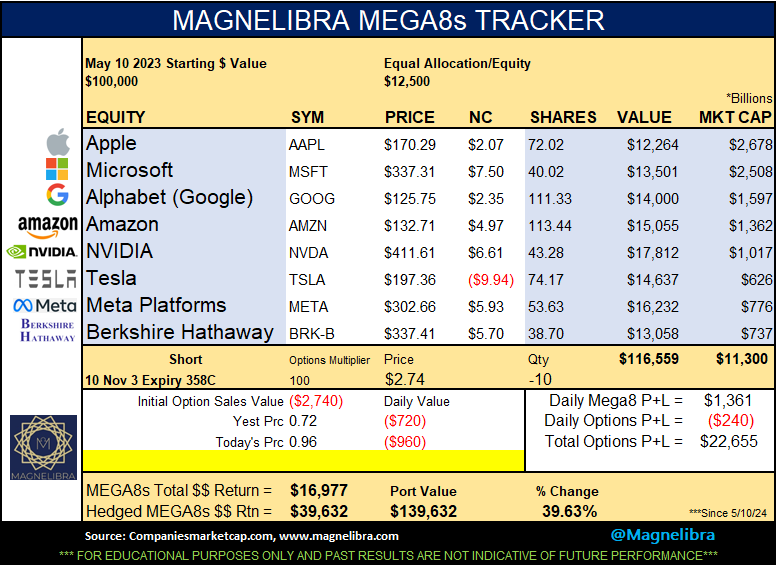
The MEGA8s tracker saw a decent recovery given the Nasdaq move, but Tesla not helping at all:
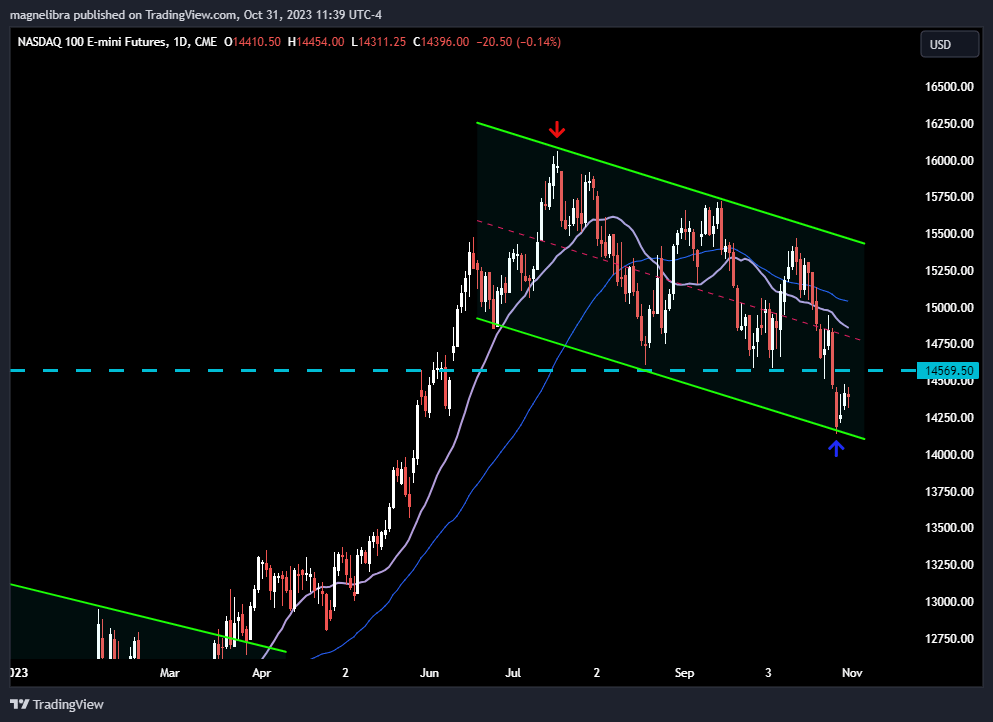
Ok we will be back with more technical charts later, for now we can tell the bottom pickers are here in the Nasdaq especially given that channel bottom that we have noted before. The Nasdaq futures can bounce and work oversold conditions off but we would suspect sellers again at the 14570 area to cap this move initially with 14750/800 area key resistance now longer term:
Please try to like, share or subscribe our work, we know everyone has a lot of resources and outlets, but we do feel we present our readers with fresh perspectives and a unique way of structuring market data, so any assistance in spreading our message is greatly appreciated.