
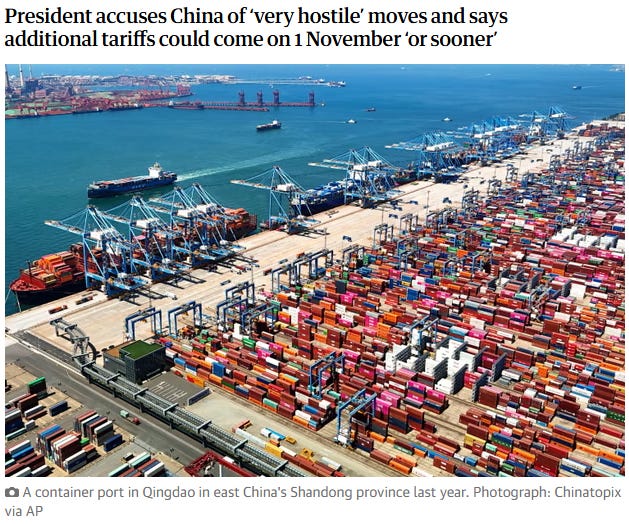
Trump Tariff Threat Hits Markets Late Friday
Crypto Market Carnage

*Equity Markets are open for Columbus Day, Cash Bond markets are closed*
The markets were hit hard late Friday in response to Trump’s tariff threats against China once again. This really isn’t new news, but for us its more of an excuse for large players to take profits, but whether this turns into a more pronounced profit taking plunge is still to be determined. We are not in the camp that this new tariff threat was the real catalyst for the losses in risk assets, but rather more of the excuse for players to remove some risk from some of their portfolios. In any case the equity markets have risen substantially and we have been accustomed to seeing short term profit taking to then be fully absorbed and the resumption of risk accumulation once again.
Will this follow the same pattern?
We have often written about how the equity markets aren’t really a reflection of the underlying economic strength, rather the markets are merely a snapshot of the ultra wealthy propensity to take on risk.
As long as the majority of players stay in the game, the game works, the only way it reverses is if contagion sets in and more and more players join the foray of profit taking. Are we at that point now? Perhaps, but there will need to be some sort of exogenous event, an event that has staying power that will determine that fate. The Trump tariff threat is not one of those long lasting catalysts, because we know Trump just plays the big boy pants card and threatens just to get a reaction. However at some point we may see a real catalyst develop, but for now, we don’t believe these tariff threats are the sort of event that can cause a more prolonged risk off reaction.
We know the markets have been driven higher and higher by the technocrat’s circle of money contributions to the future of Ai but we believe the future will hold a different fate for all this promised spending and the minute we see even the slightest of pullbacks in say Nvidia or Oracle, well then this would be the kind of data that could send markets truly South. All of this Ai hype kinda reminds us of Enron actually.
On the fundamental economic side, a negative non farm payroll will also have a more lasting impact and will force the FOMC to continue to cut rates aggressively which will also be a short term negative for risk assets.
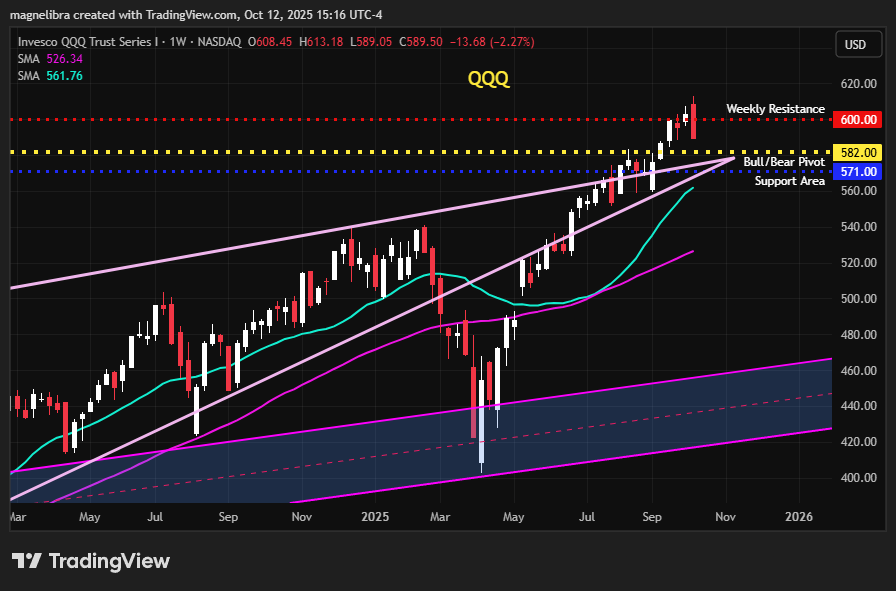
Anyway with all that said, let’s look at a few charts. Starting off with the QQQ ETF where our resistance last week at 612 correctly put a short term top in place. This week the resistance for the week moves down to 600. Our pivot remains at 582 and weekly support can be found down at 571:
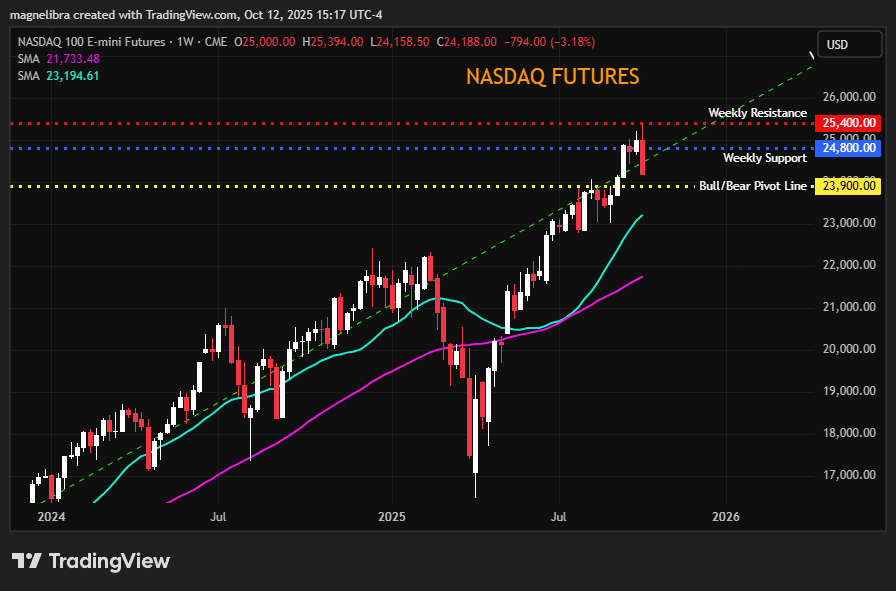
Flipping over to the Nasdaq futures last weeks resistance held almost to the print at 25400 and we then blew right thru the weekly support down at 24800. This week 23900 is massive, below there flips the mechanicals short so lets keep an eye on that level:
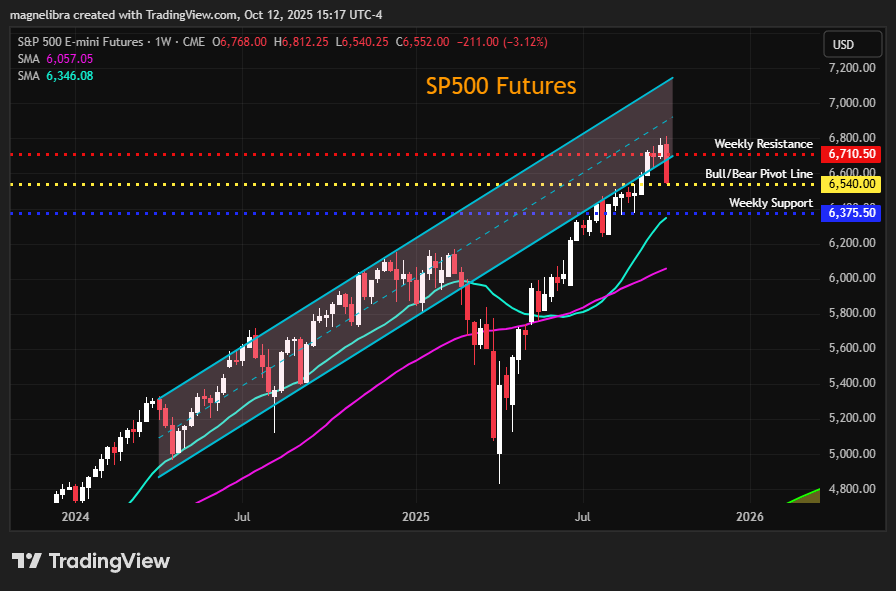
In the SP500 the market pivot is much closer at 6540 and we would suspect resistance at 6650 this week with support down at 6375. If the SP500 closes this week anywhere below 6625 we would suspect the sellers to start to press and for the bulls backs to be firmly against the wall to keep this rally in place:
When we look at the US bond market, we know the US Govt 10Y level to watch has been 4.09% and we close at 4.06% last week. The bond bulls need to continue to press below 4% to start to really give us an idea that risk may continue to see selling as money hides in fixed income, so keep an eye on the 4% level this week:
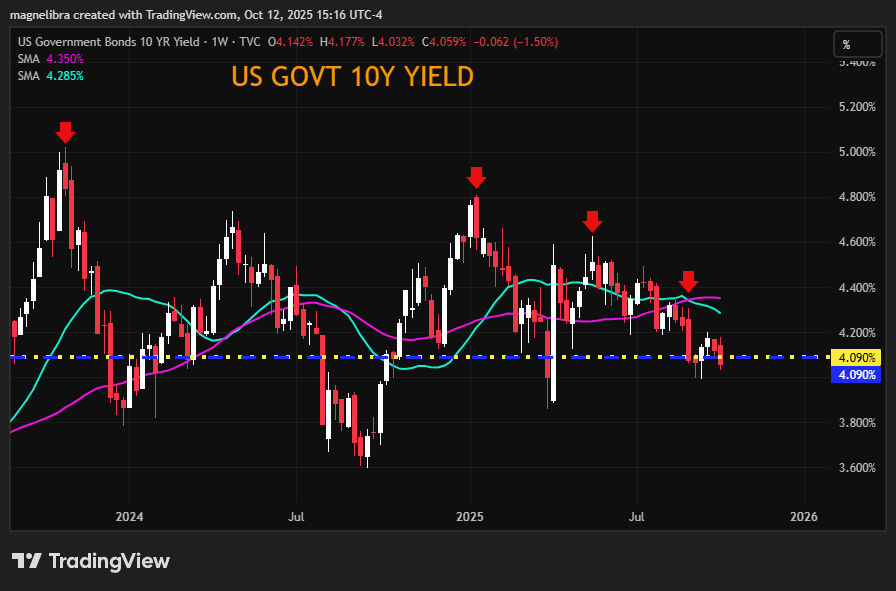
Here are our 2Y and 30Y yield charts also for reference:
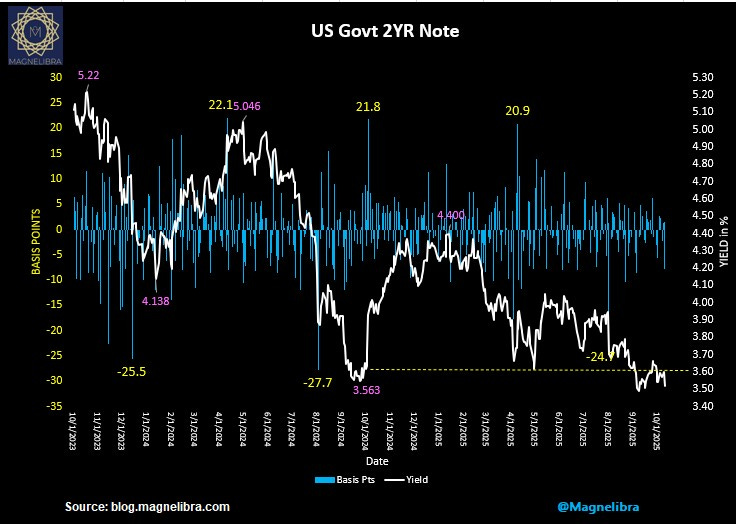
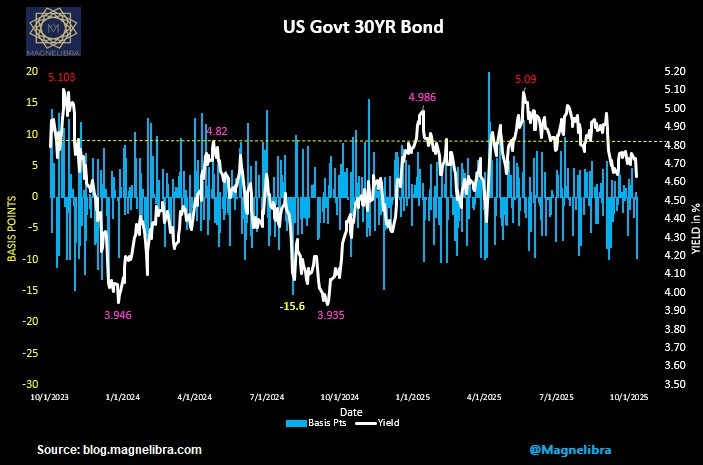
Both charts are indicating yields should continue to fall!
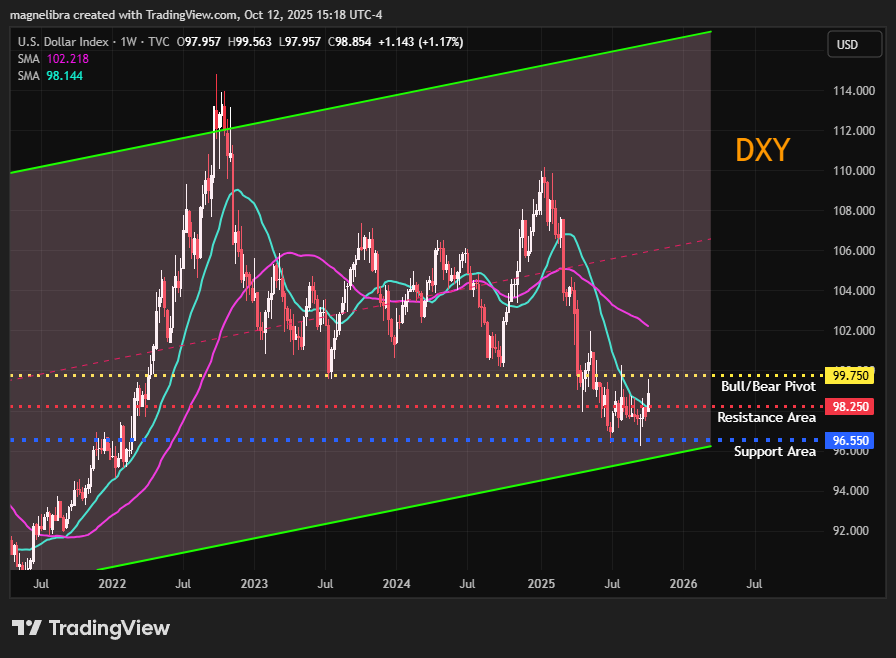
We also want to look at the US Dollar Index where a potential longer term bottom is starting to form, this would also confirm a more risk off scenario:
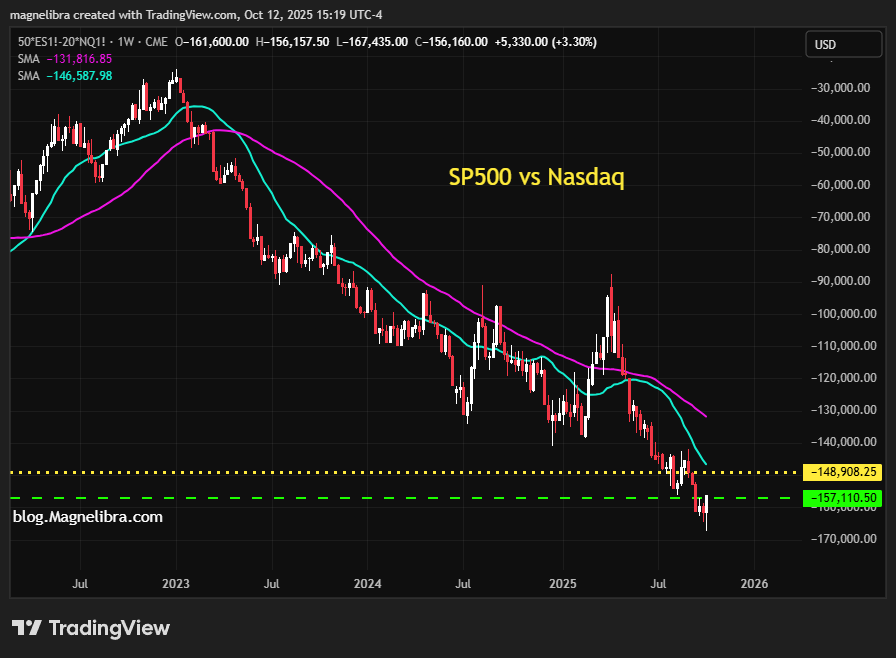
Another risk off spread we look at and watch closely is the SP500 vs Nasdaq futures spread. This week so a new low followed by a sharp rally higher and of course had to settle right near our prior support level shown in green below. If this spread starts to trade above that -148.9k level this would also confirm a more risk off scenario:
All in all guys, lets not focus on the rhetoric out there and rationale for such sell offs like Friday. Take it from us, there are always real more serious underlying factors and one of those factors is the fact that risk is historically way over priced compared to pure fundamentals. However and as you know from our own perceptions, that the markets can withstand a lot of bearish points and continue to outperform, but its contagion in profit takers from large accounts that could spill over and prove systemic. Should that occur, well then the selling will get out of hand and out of hand fast, because if its one thing big money hoarders can’t stand, its being last out of the profit taking gate. The opening to sell narrows very quickly and the percentage losses stake up very quickly especially from these large valuations. So stay with us and we should be able to decipher these moves as the come to fruition.
The cryptocurrency markets also experienced one of the most violent flash crashes in history on Friday, erasing roughly $250 billion from the total market capitalization in a matter of hours. This event dwarfed previous liquidations, such as the COVID-19 crash in March 2020 ($1.2 billion liquidated) or the FTX collapse in November 2022 ($1.6 billion), with a record $19.1 billion in positions wiped out—nearly 20 times the scale of those incidents. The sell-off was a “perfect storm” of external shocks and internal mechanics, turning a routine Friday afternoon into widespread panic, with traders on X describing it as “the worst crash in years” and “a controlled detonation, not a collapse. Some speculation is that the centralize exchanges themselves and their access to key internal trading data allows for them to profit off of certain points of pressure. Although this is speculation, as long time market traders and knowing how exchanges like the CME are regulated, its seems that the crypto centralized exchanges may be more open to manipulating things internally.
Here are some of the more key points as summarized by Grok:
Total Market Cap Wipeout: Dropped from ~$4.25 trillion to $3.87–$4.05 trillion, a 6–9% decline overall.
Bitcoin (BTC): Plunged ~10–16% from highs near $125,000 to lows below $105,000 (briefly dipping under $100,000), accounting for ~$166 billion in losses. It rebounded slightly to ~$113,000 by early Saturday but remains ~8% down from Thursday’s close.
Ethereum (ETH): Fell ~16–18% to below $3,700 from ~$4,400, wiping out ~$66 billion.
Altcoins and Memecoins: Hit hardest, with drops of 20–50% or more. Solana (SOL) cratered 11–22% to ~$180–$196 ($14 billion lost); XRP 4–11% to ~$2.52 ($6.9 billion); BNB ~10–15%; Dogecoin (DOGE) ~20–30%; and smaller tokens like SUI briefly touched $0.50 (down 80%). Many Solana-based memecoins lost 50–90% of their value in minutes.
Liquidations Breakdown: Of the $19.1 billion total, ~$16.7 billion came from long positions (bets on rising prices). BTC longs: $2.89 billion; ETH: $2.50 billion; SOL: $1.17 billion. Over 1.23 million traders were liquidated, with 78% of BTC liquidations from longs. This was the largest single-hour drawdown since March 2023.
Broader Effects: Stablecoins like Ethena’s USDe briefly depegged to $0.9996. DeFi TVL dropped 12%; BTC ETF outflows hit $500 million. Sentiment on X shifted to “extreme fear” (Fear & Greed Index at 28), with posts lamenting “incredible pain” and comparisons to the 2020 COVID dump.
As far as a more in depth look at the meltdown triggers:
Primary Trigger: Trump’s 100% Tariff Announcement on China
U.S. President Donald Trump announced an additional 100% tariff on Chinese exports (on top of existing 40% duties), effective November 1, plus new software export bans and tech restrictions. This reignited fears of a full-blown trade war, similar to 2018–2019, causing a global risk-off exodus. Stocks tanked (Dow -2.9%, S&P 500 -2.7%, Nasdaq -3.4%), the VIX fear index spiked +35%, and the U.S. dollar strengthened +1.8% (DXY). Crypto, as a high-beta risk asset, bled faster—posts on X called it the “Trump crash.” China’s response (rare earth export curbs on 12 elements) hit supply chains, further eroding confidence. This external macro shock accounted for the initial 6–7% BTC drop and set off the cascade.Amplifier: Massive Leverage and Liquidation Cascade
Overleveraged positions (up to 100x on perpetual futures) turned a sharp dip into a bloodbath. Thin weekend liquidity, algorithmic margin calls, and whale dumps (e.g., 50,000 BTC on exchanges) created a feedback loop: falling prices triggered forced sales, which drove prices lower, liquidating more positions. High correlation between assets (BTC dominance >60%) meant alts amplified the pain. This mechanical effect caused ~80–90% of the $19.1 billion in losses, as longs were “nuked” en masse. Analysts noted it as a “leverage apocalypse,” purging excess greed after BTC’s 95% YTD rally. (BTW we cannot stand the fact that exchanges offer this kind of leverage as core P2P believers, this facilitates a dangerous and more pronounced risk taking which leads to markets becoming easily destabilized)As we noted earlier, there has been speculation of manipulation as there’s talk on social media outlets that have pointed to whale shorts (e.g., one pocketing $190–200 million) and exchange glitches (e.g., buy errors on Coinbase/Kraken), fueling “rigged casino” claims. We don’t know if “rigged” is the right word, but rather sanctioned syphoning seems more appropriate.
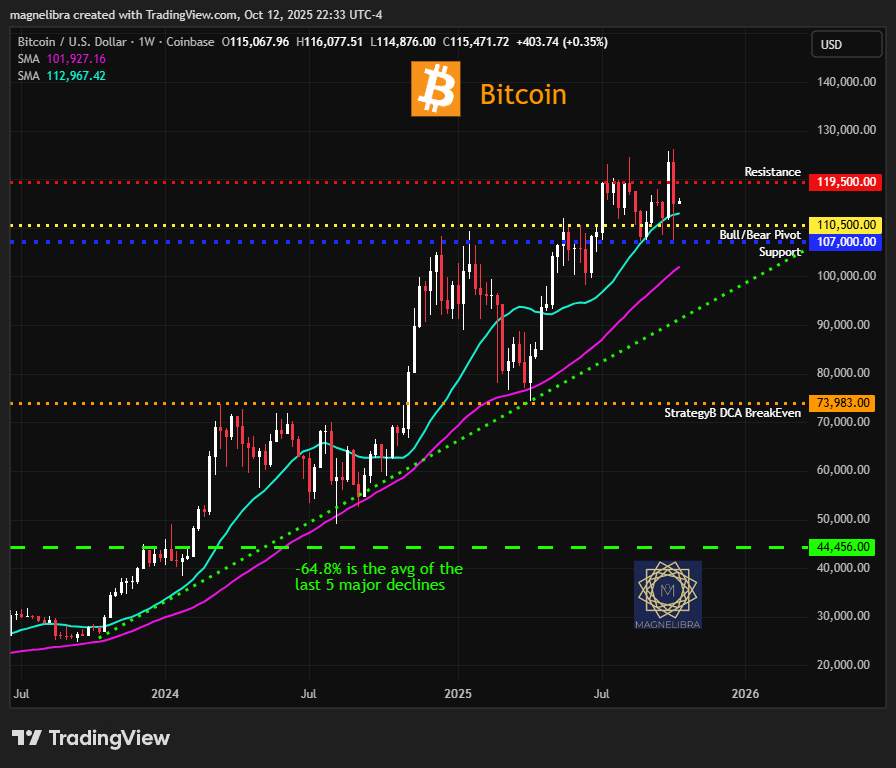
Anyway here is the current chart of Bitcoin where this weeks resistance moves back down to 119500 and support is at 107000, with 110.5k as the bull/bear pivot:
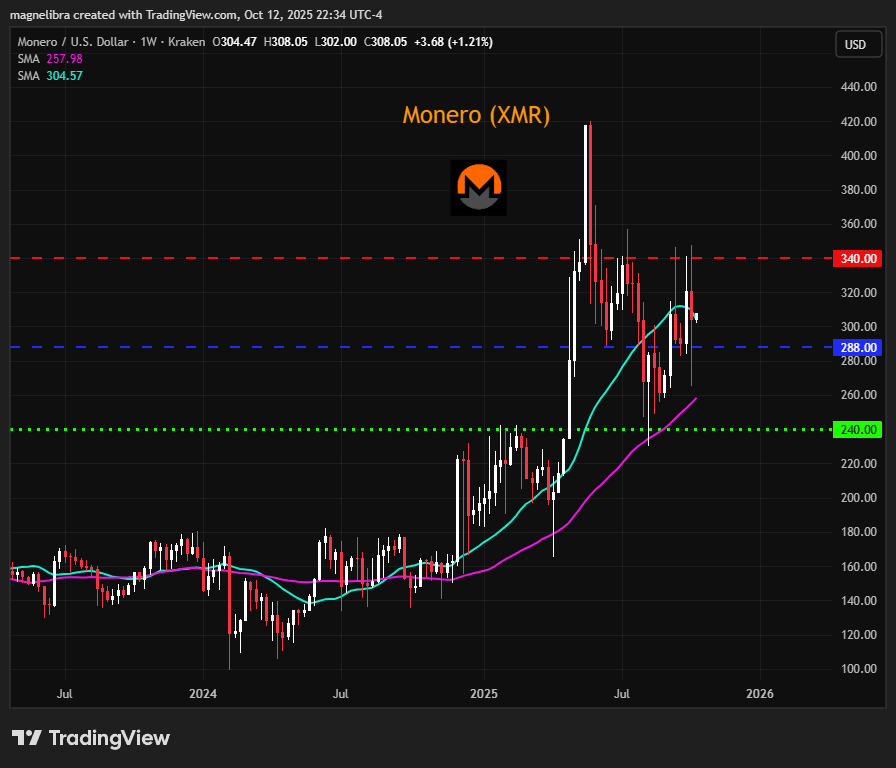
As far as Monero XMR, it had a massive range of about $75 but continues to be plagued by rejection of the $340 level:
The entirety of the crypto markets will be more susceptible to actual economic fundamentals such as a global recession and we believe risk off here will be massive should a more prolonged downturn start to rear its head, so be careful in regards to crypto overall risk should things in equity land start to roll over.
Alright guys onto the subscriber only data section. We hope you consider checking out our work here as we know it will improve how you tackle your own investing and improve your mindset on how to analyze and assess overall market moves. We cover a lot of different markets and we believe it is well worth the value! Subscribe and follow if you can and enjoy this free look!
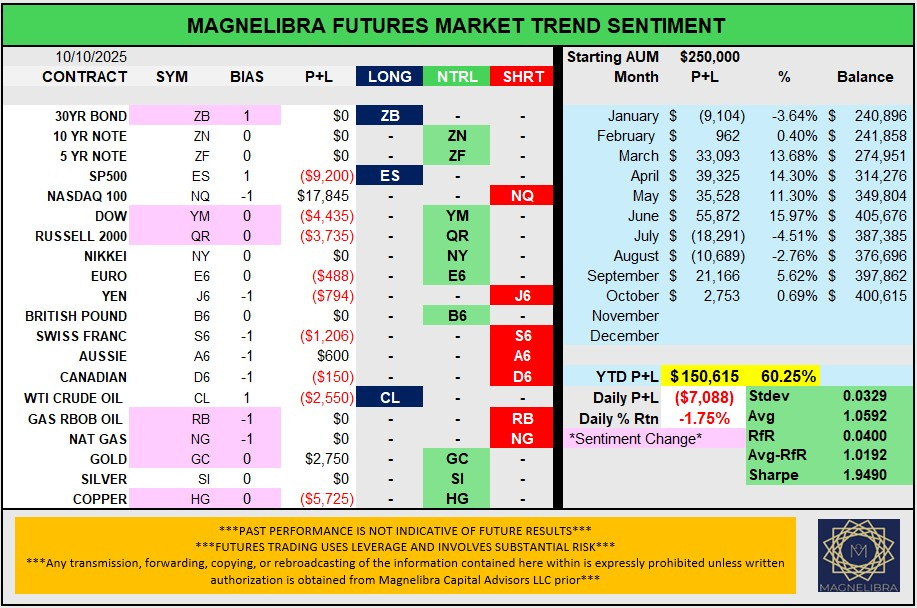
Magnelibra CTA Futures Market Trend Sentiment (Our proprietary commodity trading advisory futures market sentiment long/neutral/short market flows indicator) The portfolio is made up of the core futures markets we cover and the indicators are for single contracts of the futures market, whether long, short or zero neutral. The P+L is generated via the starting daily position and the ending daily settlement. This is considered a high risk alternative strategy. However most investors should leave a portion of their overall portfolio within a high risk basket. Some of the percentages of the overall portfolio dedicated to high risk should vary from 3% to 18% depending on ones overall time to invest and risk profiles. We added the Sharpe to our data now as well for those quantitative types!
NOTABLE CHANGES:
Move to “1” Long Bias: ZB
Move to “0” Neutral Bias: YM, QR, GC, HG
Move to “-1” Short Bias: RB, NG
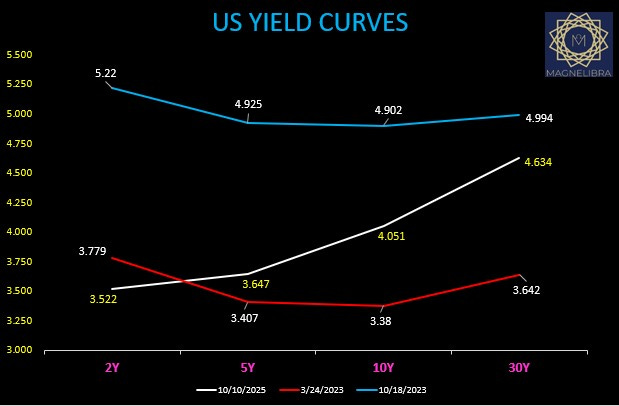
The U.S. Bond Yield Curve (This is our daily graphic displaying the U.S. bond market yield curve changes. We follow the 2 year thru 30 year durations. Please note that bond prices work inversely to yield changes so for instance if bond prices are rising and moving upward, then their yields are falling or moving downward. We also track the relationship between the durations known as US Yield Curve Spreads, when we list it as 2s5, we are comparing the yield differential between the 2 year vs the 5 year with the positive/negative viewed from the higher durations perspective.
The US yield curve continues to see the longer end outperform here:
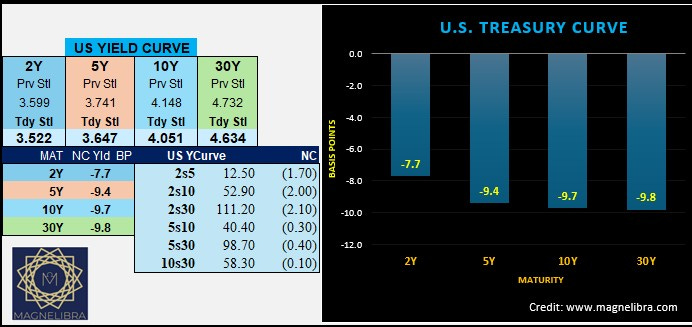
Here is Friday’s yield curve slope vs the previous high/low. This demonstrates the FOMCs ability to reshape the curve to a more positive slope from its prior flatter trend:
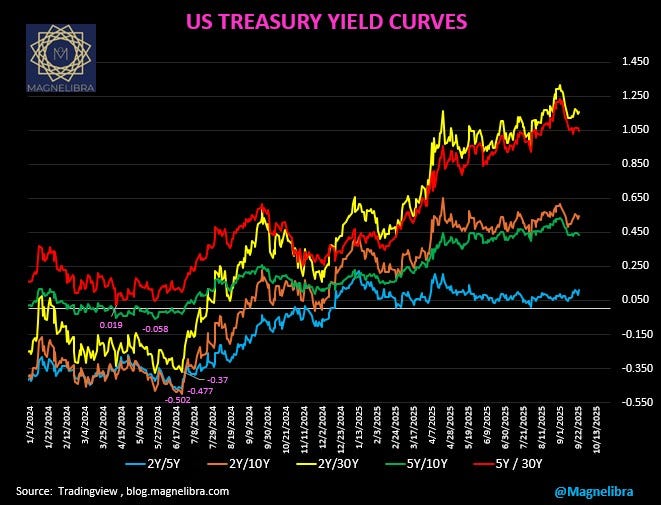
This next chart plots the main US yield curve spreads and you can see the short end outperformance vs the long end since the start of this year:
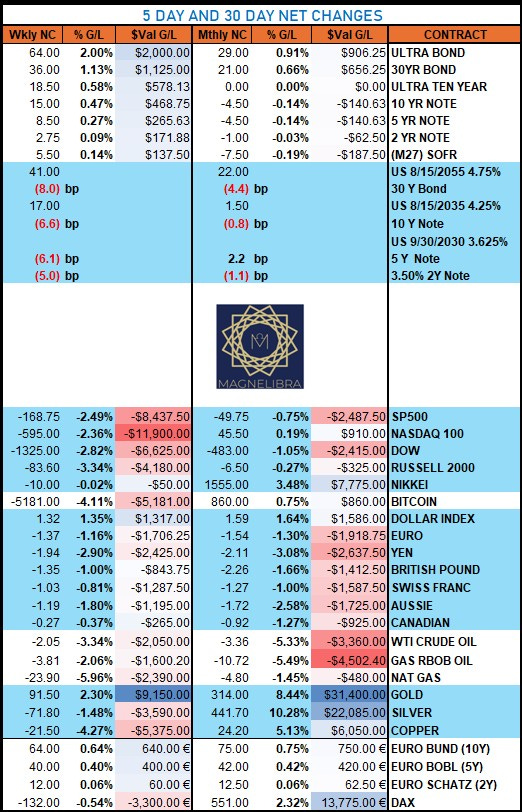
Daily Settlement Sheet (Magnelibra’s Futures and Cash bond market coverage of the daily settlement prices and dollar value of the contracts given move)
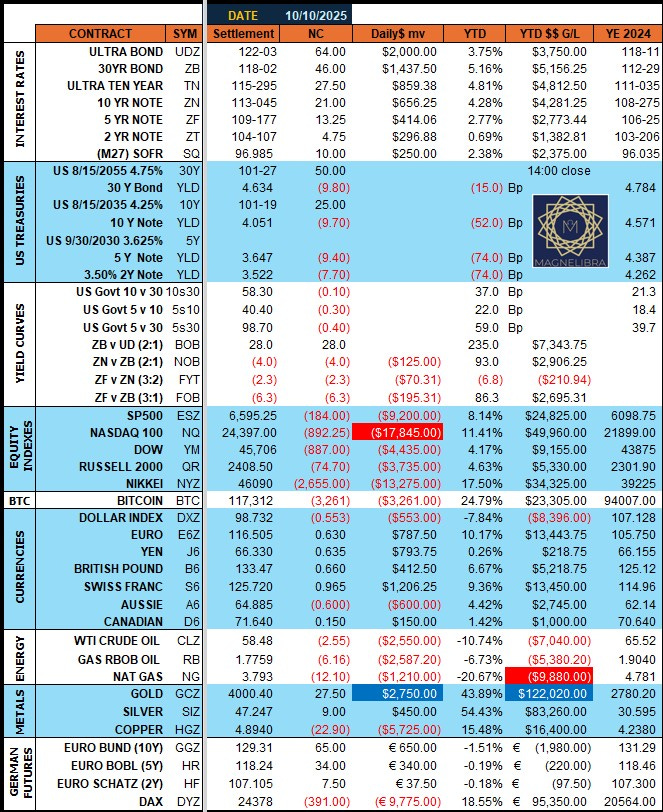
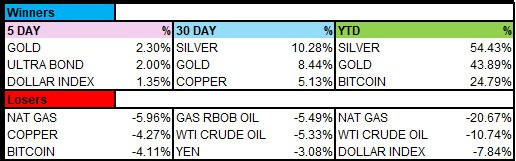
The 5 & 30 Day rolling changes with top 3 Winners and losers (The last 5 trading days and 22 trading days net changes)
Silver, Gold and Bitcoin the YTD winners still:
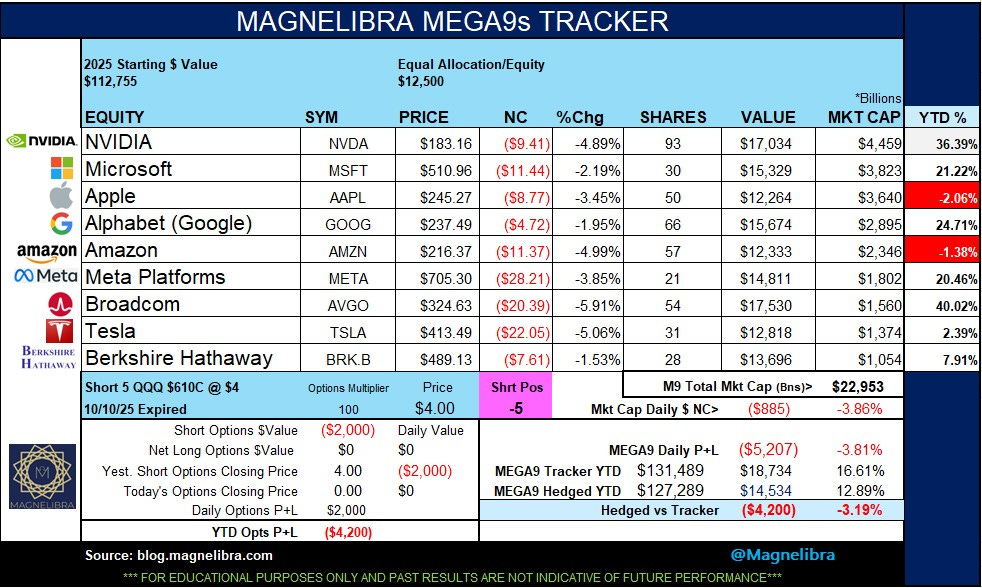
Magnelibra MEGA9s Portfolio Tracker (This is a synthetic long only portfolio of the Top 9 largest equities by market cap. We started this tracker because we understand Ai dominates the investment landscape and operates in a binary construct. What we mean is that it issues a buy or a sell and will do so in reinforcing mechanisms, meaning if alpha is rising it will add, if it is falling it well sell and remove. We also created a “hedge” for those that want a more active approach to tactically maximizing their long only static portfolio of equities)
The QQQ ETF $610 Call at $4.00 was last weeks hedge hit on Friday and this week we will await a rally to try to get off a decent hedge short call or maybe even long put. Monday should provide a better hedge idea for the week and we will keep you posted. As far as Friday’s MEGA9s they were hammered tumbling $885 billion in market cap its worse drop since April 4th! Broadcom led the group lower, falling 5.9% followed by Tesla, Amazon and then Nvidia all falling 5% or so:
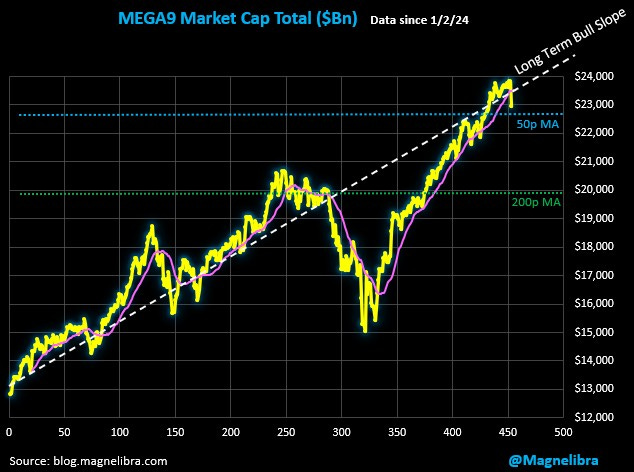
MEGA9s total market cap chart (This chart represents the total market cap of the MEGA9s and lists the 21pMA in pink along with the 50p and 200p MA)
The 21pMA has been broken and now looking at the 50p MA for support here. Technical damage has been done and we would suspect early flows this week will determine the path of the rest of the week. We either settle in on Monday and see some support or risk a continuation move below the 50p MA:
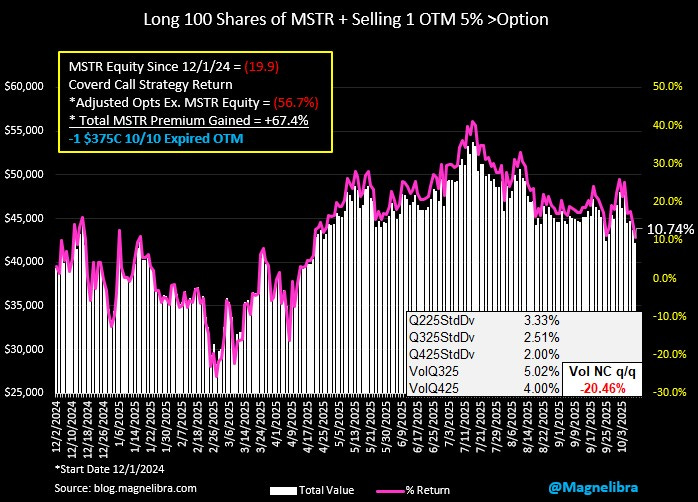
Strategy Inc / BTC Trading Tracker (Bitcoin vs MSTR equity, Our Strategy Inc. Covered Call Portfolio Tracker, Long 100 shares MSTR and short 1, 3% to 7% out of the money call on Monday’s open each week) For those playing along at home, please note, this long MSTR strategy that incorporates a short covered call hedge is something you cannot pick and choose to do one week to the next! This is a mandatory weekly hedge vs your long holdings. Volatility continues to get stripped out and crushed, buying Bitcoin outright vs MSTR is always the preferred exposure, if you were wondering.
The hedge last week for the covered call strategy was the $375C which expired worthless. We have said it time and time again, if you want BTC exposure, your better off owning the BTC outright and not some pseudo derivative like MSTR. If you want exposure via MSTR, then we suggest if your account value warrants it, to sell covered calls to hedge your risk and lower your overall risk over time. Since we started actively tracking this strategy, MSTR is -19.9% outright but the covered call strategy we outline is +10.7%, massive outperformance:
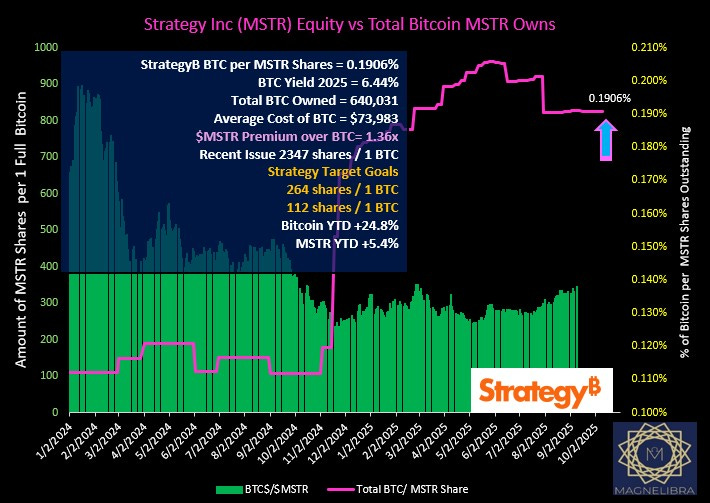
BTC/MSTR shares = 0.1906 and Total BTC owned = 640,031 and the dollar cost average = $73,983 with the premium metric continues to plunge now down to 1.36x. We also added the BTC and MSTR YTD metrics to the data chart:
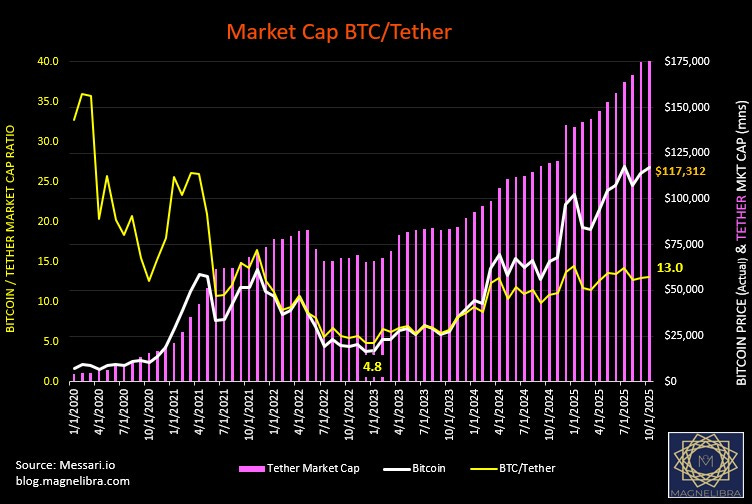
Finally we want to share our BTC/Tether market cap comparison chart. We still cannot figure out how Tether Market cap continues to rise despite massive crypto liquidations. Sure some of it could remain in USDT via liquidation out of say BTC, Ethereum, Solana etc…but are we to believe that investors never convert back out to fiat? We doubt that is the case and as we suspect is a more legitimate answer, is that one day we will uncover the fact these stable coins are nothing more than digital representation of real cash that isn’t backed 1:1:
Ok that is it, we wish you all the best this week. We are continuing our push out to investors with our digital strategy as we migrate away from traditional global macro. Our viewpoint is simple, the future of investing and money lies within decentralized P2P tokenized and private capital. We believe we have the right 20year vision for this and have created a comprehensive game plan outlining what we believe will be the best asymmetrical set up to take advantage of this migration. Fiat is dying and dying fast and the migration to the new monetary system will take place regardless of the position of the centralized debt money printers. That is our belief and our outline is set to take advantage of this migration! If you are a large allocator, or UHNW investor please reach out and we would be happy to discuss this direction with you. We discuss a lot of what we believe here and hope that you are benefitting from our knowledge.
Alright that is it, we hope our letter demonstrates the power of being an active investor vs your static long only holdings. In today’s world there are only excuses when it comes to losses, you should be active and do things that mitigate your overall risk, to not do so is purely just lazy. If you need to review your own risk, we would be glad to help, we can simplify pretty much everything and offer you a new way to look at investing. Too many of you often use mutual funds, often pay 1% or more for passive investing and chalk it up to the fact that this is how old grand dad did it that is how I will do it. Well don’t be foolish, today’s markets are nothing like even a decade ago, let alone a generation ago. We hope we are giving you a better and clearer proof of that then anyone else. Anyway reach out send a DM here, send an email and let’s discuss what you can do, its a matter of being proactive rather than being just pure laziness!
Thank you guys, appreciate all the support and thank you for reading our work and hopefully your gaining valuable insight and improving your own techniques and improving your non linear thought processes. We feel that support of our letter and the pricing of our tiers is more than fair market, so please think about supporting our work, till next time. Cheers!
Support directly to our BTC address if you can: 3DvDvPnjwu5Fd6sagAYmiFXA2fPkjJf2cp
Anyone interested in investing in Monero (XMR) please reach out, we have a link to Kraken below if you use my referral code or link to try it, we’ll both earn 75 USD when you trade $200 USD of crypto in the app!
Code: y4wsyws7
Link: https://proinvite.kraken.com/9f1e/11l9bp1z
Additionally we would be glad to consult anyone interested in getting involved here. As always we view these crypto currencies in the same realm as futures, high risk, high reward, and every portfolio should have a small percentage of their overall portfolio in investments like this.
So if interested please reach out to the email below directly and we can discuss this further. The future of financial payment systems will be digital decentralized and we are still in the infancy of this fascinating technology!
If anyone is interested in working on a digital currency project and joining in as a core investor to help lay the foundation for what is to come, please reach out!
Cheers,
Magnelibra