

While working with one of our top analysts this week and while reviewing the week ahead, there was one theme that stuck out to us and its a phrase that will define 2023,
UP ON HOPE, DOWN ON REALITY!
We have seen this reoccurring theme for the greater part of the last 2 decades, which were clearly defined and confined to pretty much one thing and one thing only…consistent global coordinated central bank quantitative easing.
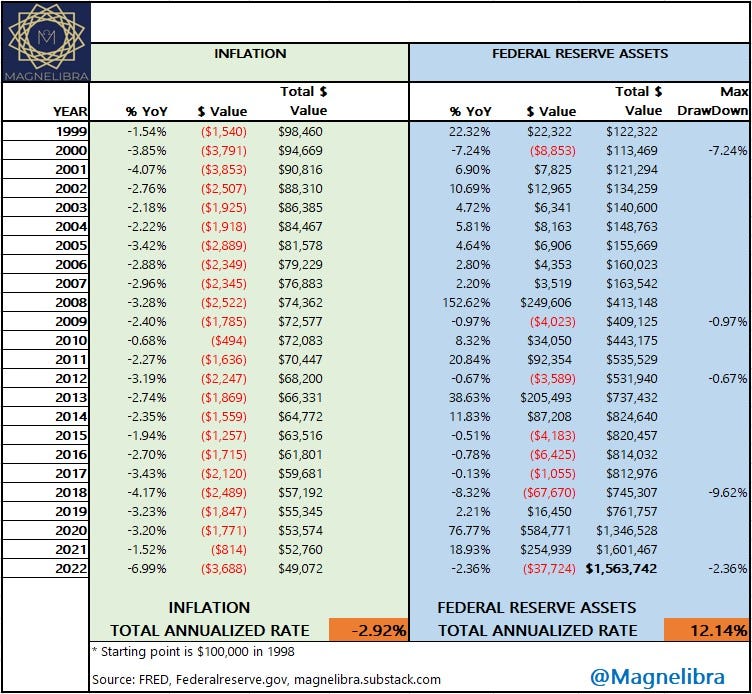
Our last letter highlighted the insane but data driven fact that the Federal Reserve has on an annualized basis, increased their asset purchases at a 12% clip. This is massive, it should not be discounted by any rational means. For decades this debt driven, fractionally reserved bonanza enhanced leveraged investor appetite for anything and everything. This practice of buying assets by a non zero sum player like a central bank, is for all intents and purposes a massive cover up for the persistent organic economic decline of American domestic production. Its as if we as a nation can simply print dollars to export around the globe and continue to buy real goods and services in return.
Yes this has worked out for the greater part of this entire century, yet the reality now is, every country cannot do this and its become obvious that China has drawn that line in the sand as they too and their PBOC over the last few years has taken the playbook from the FOMC and have done the same thing. In fact we discussed this on a few LinkedIn posts recently by which it seems a lot of people think current values based upon a soft landing and this great China reopening will be a boom for global growth and risk assets…cough, cough, sorry it will do nothing of the sort!
The PBOC bailed things out in 2019 but that is not about to be repeated, in the later part of 2018 and throughout 2019 the PBOC injected nearly $2T Yuan in direct liquidity and via reserve requirement reductions, which pushed all assets to new highs into Covid!
Fundamental economics have been greatly distorted by QE and the Zero bound for far too long and the inflation factor which is far stickier than many economists will care to admit, has now taken hold. Inflation kills central bank QE policies because it exposes the fallacy of it, its a mirage of value, plain and simple. I.E. if the global central banks can’t expand balance sheets, global risk prices collapse. Then once INFLATION becomes sticky they cannot enact further QE without causing more inflation, this paradox is where the central bank finds itself today.
We hope you are getting this by now. With that said let’s take a look at a few things, one, let’s look at the FOMCs change YoY in the structure of their duration of bond holdings. What we see is a quasi Operation Twist 2.0 by which the FOMC sells off the belly of its holdings while increasing duration in the 10+ year sector of holdings:
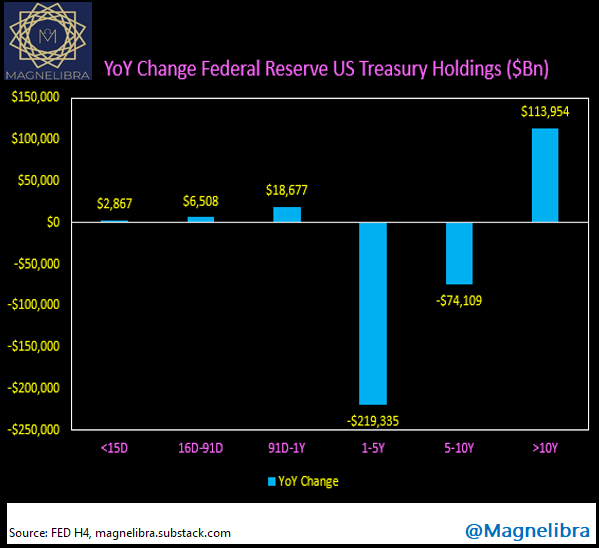
This is exacerbating the already historical inversion, but it is the correct play by our central bank as they know they need to accumulate higher coupon, longer duration maturities, before they are forced to go full blow QE4EVR again. So they have added $113Bn of 10Y plus securities, while liquidating $293Bn or so of 1-10 Yr sector maturities with the bulk of the selling coming in the form of 1-5Y durations…
Now if you didn’t read last weeks post, here is that chart of inflation vs annualized Asset purchases by the Federal Reserve where you can see the 12% growth, as well as see the fact that in 24 years, your US Dollar has lost over half its value via the 2.92% annualized inflation:
Now we hope from all of this you can surmise that central bank policies hurt one class of people at the expense of another. This is also why we believe this is a real threat to American Civility and America’s ability to organically grow a stable and viable economic environment. We would honestly like to know how and why the Federal Reserve targets 2% inflation, which they have never hit on an annualized basis and even more so, why do they need to increase assets at 12% a year?
This should be at the forefront of Congressional oversight committees, we know it will fall on deaf ears, we have watched countless congressional members from Ron Paul and others fail to enact on the data they saw and understood. Well we know why it falls on deaf ears, because the machine is massive and its the system we are all a part of and its easier to kick the can then enact any real change.
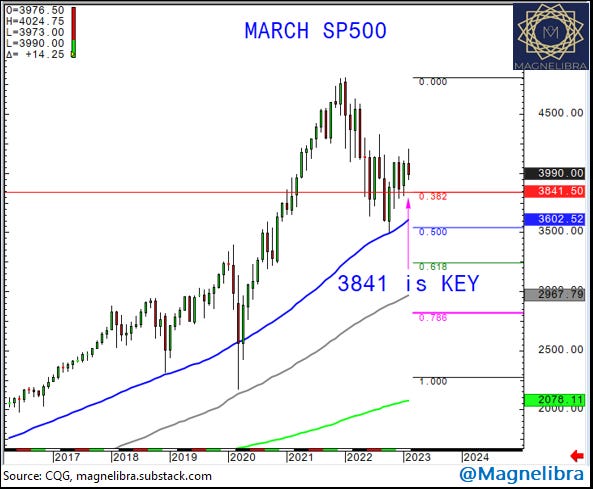
With all this said, we would like to look at one single chart, the one chart that we believe will usher in the end to this bullish risk on mentality for this cycle once and for all. The level we are watching is 3841 in the March SP500. We know the long term buyers were there at 3625/3600/3575 and if this level gives way, their resolve should be tested. The 50p Vwap comes right in near that area so you can see how far on the monthly we are from these key points, most would say real value rests at the 100 or 200p Vwaps well below:
We know that the US Dollar is also key here and its recent strength could wane and risk assets may be supported then. However we believe this would only be temporary as we cannot stress enough that both historical and current data does not suggest to us that we will have a soft landing. Everything we look at is tilted toward the hard landing scenario, which we believe, is not priced in at all.
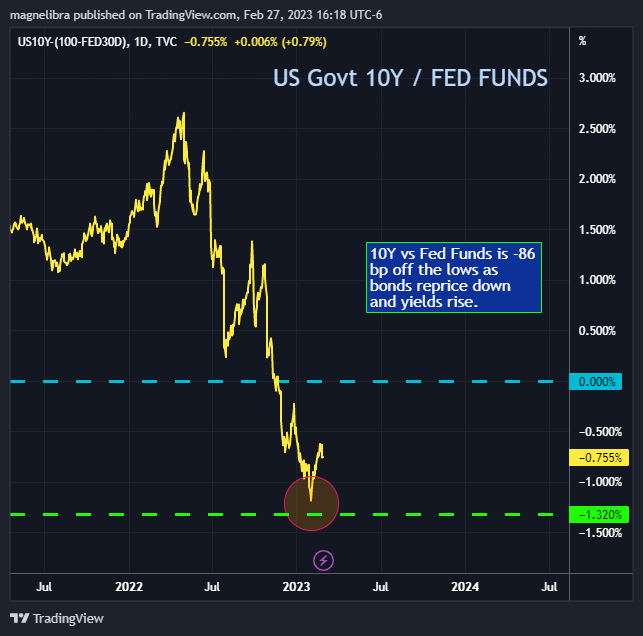
We feel that the equity market cannot withstand another quarter of this type of inversion and if the FOMC does go 25bp in March then the current inversion will only get worse as the terminal rate and Fed pause gets moved further in time. We know a lot of mean reverting players have most likely loaded up on curve steepeners and we have seen covering in that sector over the last month and rightfully so. You can see in the next chart US Govt 10Y vs FED FUNDS has bounced from the -132bp area lows to -75bp as 10Y yields have risen off their recent lows running from 3.32% to 3.92%:
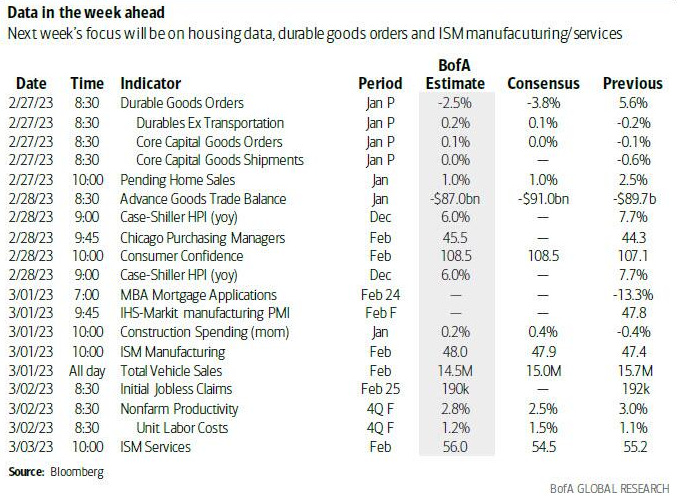
Alright, we will key on the SP500 for now as we said, a trade back above 4000 would see some reprieve, but we know systematic CTAs will be large sellers on sustained moves below here and again if we fall below 3945 so keep an eye out here. We will see some month end rebalancing which may favor bonds vs equities here. As far as this weeks data, here you go. All eyes will be on Friday’s ISM Services:
Till next time, we have lowered our subscription costs to reflect worsening economic conditions all around and in hopes that we gain a wider audience so that they feel they are truly getting their moneys worth. We know how hard it is to get good insight and we hope you spread the word so that more can benefit from the work we do!
DISCLAIMER: For educational purposes only. This is not a solicitation to buy or sell commodity futures or options. The risk of trading securities, futures and options can be substantial and is not for everyone. Such investments may not be appropriate for the recipient. The valuation of futures and options may fluctuate, and, as a result, clients may lose more than their original investment. Nothing contained in this message may be construed as an express or an implied promise, guarantee or implication by, of, or from the author Michael Agne owner of Magnelibra Capital Advisors. Magnelibra the CTA and its Global Futures Benchmark Program may hold long and or short positions in the various futures and markets that Econemotions covers. We will never claim that you will profit or that losses can or will be limited in any manner whatsoever. Past performance is not necessarily indicative of future results. Although care has been taken to assure the accuracy, completeness and reliability of the information contained herein, we make no warranty, express or implied, or assume any legal liability or responsibility for the accuracy, completeness, reliability or usefulness of any information, product, service or process disclosed.
ALL RIGHTS RESERVED 2023