

When we look at the shape of the yield curve in our current environment of higher rates to come, the general move would be for the shorter duration Notes to rise in yields faster than their longer duration counterpart Bonds. The general thesis is that they tend to revert back to trend (lower rates forever) theme and the yield curve after a short period of inversion, goes back to a more normal positively sloped one. Here is a basic illustration:
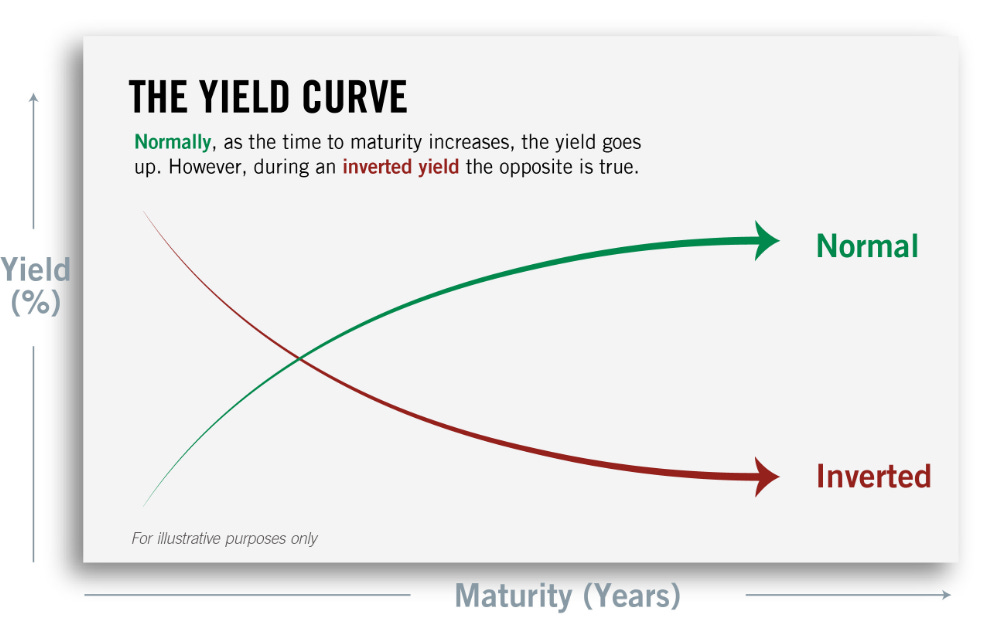
The inverted yield curve is what we currently have now, given the record pace of rate hikes over the better part of 2022 (As of yesterday the US Govt 5s30 curve was -23bp).
However as the economy cools off and we move into a recession, the central banks are quick to reverse this course and pause their rate hikes or even begin to pivot. Right now we are still on course for a 75bp move here in a few weeks. However the real question is how far or how high can they raise the Fed Funds rate, or what many MSMedia are calling the “Terminal Rate”?
As you can see now, the US Govt 10Y is currently 100 bp or so above the FED FUNDS rate, so this curve is still positively sloped. It is still so because inflation is still high and bond traders know that the FED will have to continue to raise rates until inflation comes down, so they continue to force the FEDs hand in a way.
When the Bond market starts to buy US treasury notes i.e. the US 10Y govt Note, then the rate will fall below that of the Fed Funds rate and the Central Bank can then start to pause or pivot. It is our assessment that the Federal Reserve is taking its cue, as it should from the bond market and will continue to raise as long as inflation remains elevated and that only when the overall bond market starts to signal an inversion of this curve will the FED start to pause. Here is a picture right now of the US Govt 10Y/FEDFUNDs curve. (The redline down anticipates where the curve will be come Nov 2nd and assuming the 10Y remains near 4.25%):
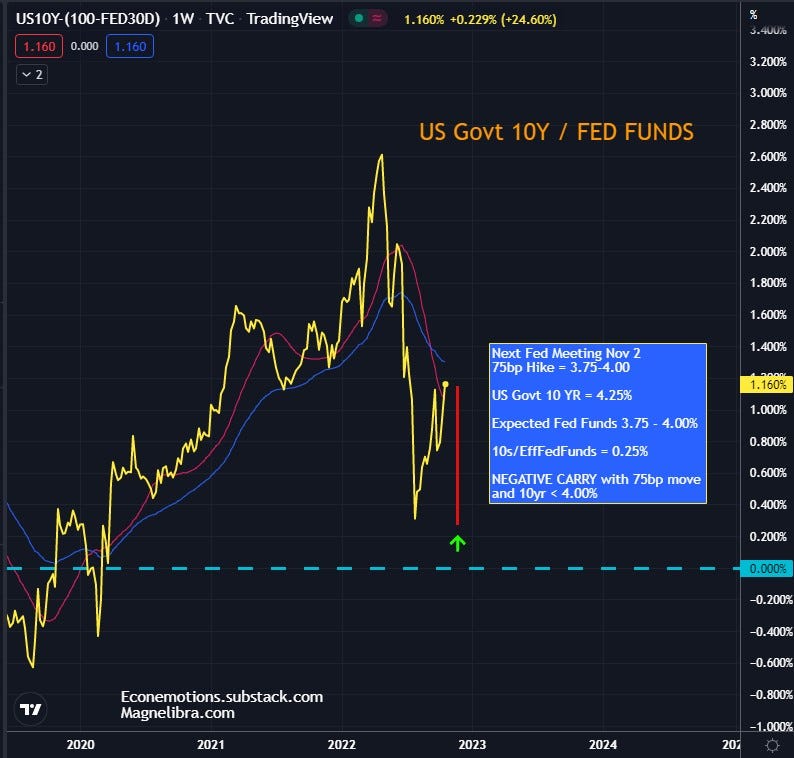
This yield curve is by far the most important curve we have today. The main stream media is not allowed to talk about this curve, because they don’t want it to become the focal point of the consensus. However veteran bond traders know that this is the “real curve” and it is way more important today, then ever before. Why? Because everyday the Federal Reserve is paying interest on excess reserves (IOER) which is nothing more than paying counterparties (banks) not to lend money and take risk. Secondly they are paying RRP or Reverse Repo overnight rates on about $2.6T or so. Do you know how much 4% on $2.2T is? We do, that’s $241 Million per day!!!
We do expect if the Federal Reserve goes to far and allows the Bond market to punch this yield curve negative, then rest assure, asset prices will get hit hard and we would anticipate new lows in the equities complex. We know that every single corporation has taken the Modigliani/Miller preposition to a whole new level and with their debt as high as it is…well you can kiss margin and roll over debt to kill any profits they may have considering total debt levels have more than doubled in a decade!
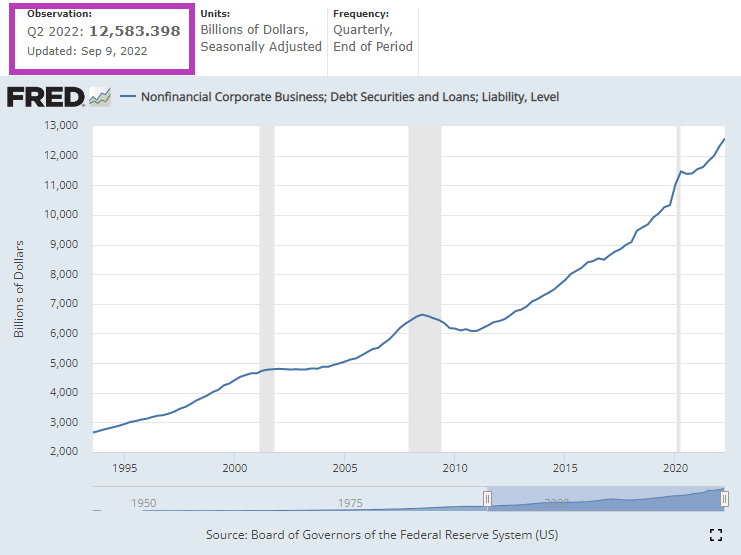
So when your friends ask you why the Federal Reserve is raising rates, now you know its to curb inflation (which they caused) and to also give banks a lot of risk free capital!
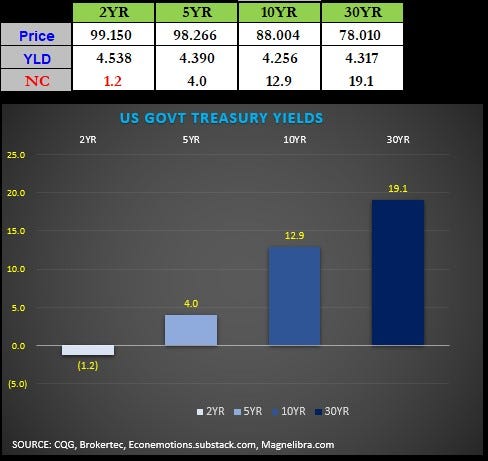
Ok as of this morning here is a quick update on the yield curves and you can see the front end is up huge (yields down) while the long end is getting hit hard (yields up):
As far as last nights trade, the equities were lower, but we heard a whisper out of the WSJ that the Fed is nearing its pause or pivot time…hah well we know what curve to look at now don’t we…anyway they reversed course on the NY open:
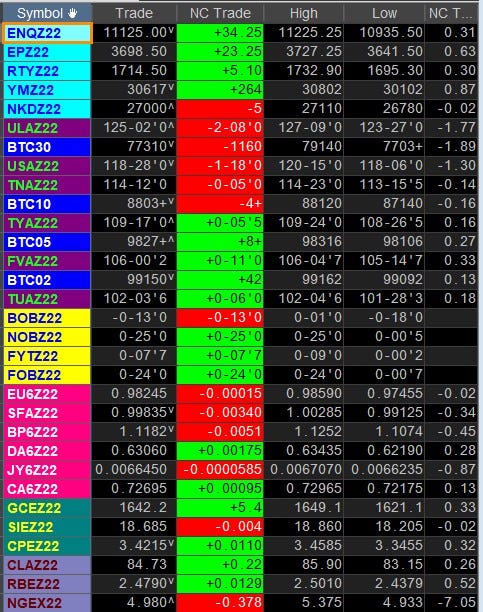
Ok as we told you yesterday, we have seen large selling in that longer dated complex of US Treasuries lately and today we found out why!!! Till next time…
DISCLAIMER: For educational purposes only. This is not a solicitation to buy or sell commodity futures or options. The risk of trading securities, futures and options can be substantial and is not for everyone. Such investments may not be appropriate for the recipient. The valuation of futures and options may fluctuate, and, as a result, clients may lose more than their original investment. Nothing contained in this message may be construed as an express or an implied promise, guarantee or implication by, of, or from the author Michael Agne owner of Magnelibra Capital Advisors. Magnelibra the CTA and its Global Futures Benchmark Program may hold long and or short positions in the various futures and markets that Econemotions covers. We will never claim that you will profit or that losses can or will be limited in any manner whatsoever. Past performance is not necessarily indicative of future results. Although care has been taken to assure the accuracy, completeness and reliability of the information contained herein, we make no warranty, express or implied, or assume any legal liability or responsibility for the accuracy, completeness, reliability or usefulness of any information, product, service or process disclosed.
ALL RIGHTS RESERVED 2022