

Thank you guys for joining me and welcome to Episode 22 of Season 2 brought to you by Magnelibra Trading & Research (MTR). This episode is entitled “Value is it Subjective?”
Quick Disclaimer: The following podcast is for educational purposes only. This is not a solicitation to buy or sell commodity futures or options. The risk of trading securities, futures and options can be substantial and may not be appropriate for all listeners.
Whether its the stock market, the bond market or the real estate market, the idea of placing value seems easy on the fore front, but in reality its really very difficult. When we look at a the plethora of inputs that exist when it comes to singling out any investment, there are many ways one could shape and twist their idea of what constitutes value and generate narrative that supports their valuation. We see this all the time with analysts, the reoccurring theme, especially in the equity and real estate market is that “prices will rise over time.”
Yes we hear it all the time and in a general sense yes prices do tend to rise, especially asset prices, or nominal asset prices that is. The bigger question is, why though? If you ask people why prices rise, the general answer will be, “because they just do.”
Very few readers, except Magnelibra readers and listeners of course, because we break it down to you, the reality behind the drivers of prices, usually the FOMC itself. Yes we know its not as easy as just blaming the FOMC, and we don’t blame them, we just point out that they are the “enablers” because they are our defacto monetary overlords, determining not only supply of money, but the cost of money.
Banks create money by creating loans, yea back in the olden days sure, but that is not the case so much today. There is a massive shadow bank system that creates money and it is extrapolated by our own US government overspending as well as the base line asset increase in the FOMC balance sheet. Yes it is true that if bank loans don’t expand then, money supply will contract as prior loans are paid off and new ones are not issued. However with non bank lenders (NBLs) expanding at a huge pace, then the shift of risk has moved from traditional banks to these non bank lenders, such as corporates, themselves, Venture Capitalists, Private Equity, ABS (Asset Backed Security) providers. This shift of risk however doesn’t change the ultimate back stop, which is the FOMC themselves.
Back in the late 90s and early 2000s the focus was always systemic “banking” risk or what are known as GSIBs (Globally Systemic Investment Banks). Although these entities carry risk still, they are significantly more capitalized, thus the real issues are most likely now embedded in these NBLs.
This is where our “VALUE” story begins, because what we have had over the last decade of zero rates and then post covid monetary bazooka prints, is a massive dislocation between realized value and unrealized value. We have a massive amount of unrealized value in the real estate market because there is plenty of equity embedded in homes yet, is virtually sterilized because of the 8% plus HELOC rates. This is a direct result of the FOMC keeping short term rates higher for longer, which we actually agree with.
So today’s perceived value is dictated from a decade plus of zero or lower rates and further exacerbated by an FOMC that has gone 3x on their balance sheet assets (base money growth) on top of the post covid $5Tn plus in fiscal and monetary stimulus.
So when we speak of value today and knowing all that has transpired post covid now and considering rates and a shrinking balance sheet, well its no wonder VALUE is now being called into question. We see Equity prices starting to waver, we see wave after wave of commercial real estate being written down and or sustaining major revaluations. Now we want you to understand one very fundamental thing, when a commercial real estate property has a note on it for say $100m and then the owner goes into default and then sells for say 50c on the dollar, that $50m loss is realized and if there is leverage tied to it from the initial note issuer, well than that leverage is most likely being destroyed or other assets have to be sold as collateral for other loans gets revalued. This is where you get that cascading affect, it goes slowly then all of a sudden as collateral is systematically revalued and money itself is revalued.
We saw an interesting chart from Danielle Dimartino Booth today on X, here it is:
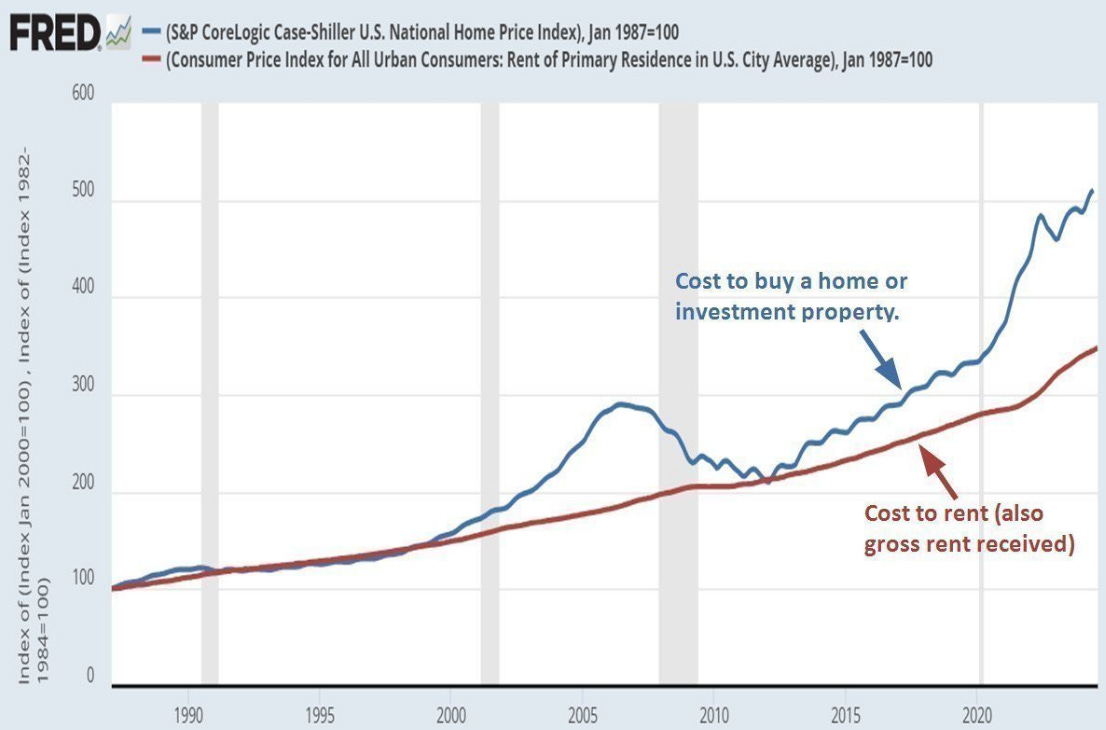
Its the chart of cost to buy vs rent. She posed the question as to what it will take to converge these lines once again. I posted my estimated solution and equation which basically calls for a 6% annualized reduction in real estate prices vs a 1% increase in annualized rent. The equations point to a convergence in 2030. This is Magnelibra’s base case as we feel the FOMC will be shackled to the Trump Administrations quest to lower short term rates, but refrain from increasing its balance sheet. The result will be a super positively sloped US yield curve, one that pushes the 5/30s curve to +200bp and keeps the longer end 20Year plus terms higher in yield. This will also keep MBS elevated (mortgage backed securities) as risk itself is perceived to have risen due to defaults, price declines and increased volatility. Here is the equation we are using for our 2030 convergence:
H(t) = H₀ * (1 - 0.06)ᵗ (6% ann. price decline)
R(t) = R₀ * (1 + 0.01)ᵗ (1% ann. rent increase)
H(t) = Cost to buy at time t
R(t) = Cost to rent at time t
Cost to Buy (H₀):
510 Cost to Rent (R₀): 350
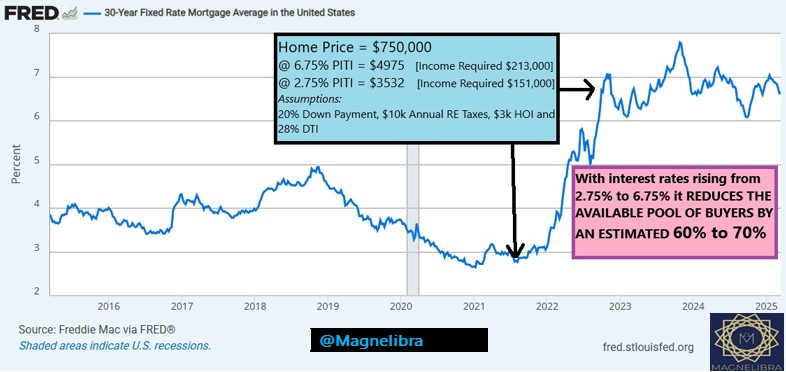
We will receive a lot of backlash on this call of ours, but its what the tea leaves tell us given the current data and economic backdrop. We also believe many in the real estate world fail to understand the concept of value as well because with housing prices still elevated alongside mortgage rates 6.5% or >, people still perceive prices as sustainable. The concept we want you guys to understand is the concept of relative available buyers and the differential in that pool of buyers at a given interest rate. We have a chart here that shows the difference between the cost of a mortgage at 6.75% vs 2.75% and it is in our estimate that the available pool of buyers at this given interest rate differential is reduced by 65% on average. Couple this with a slow down in the general economy and its safe to say, if you want to sell your home now, you better discount it to reflect this reality:
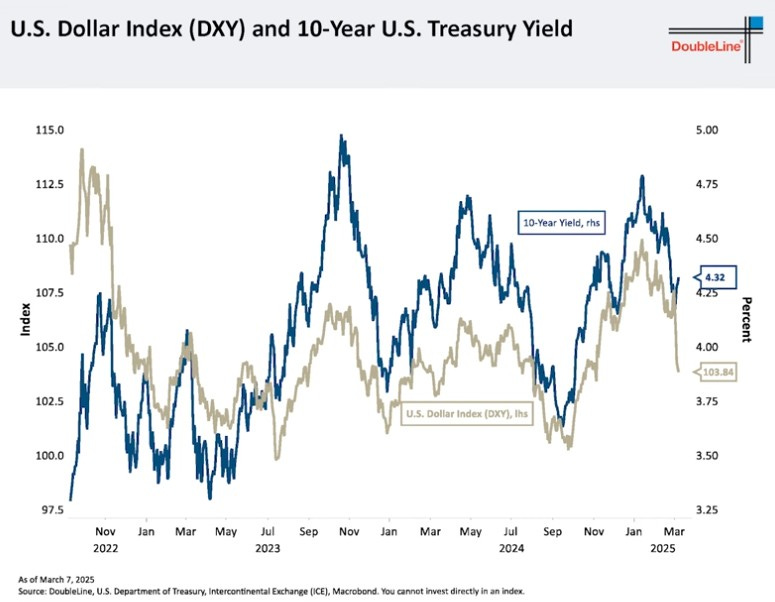
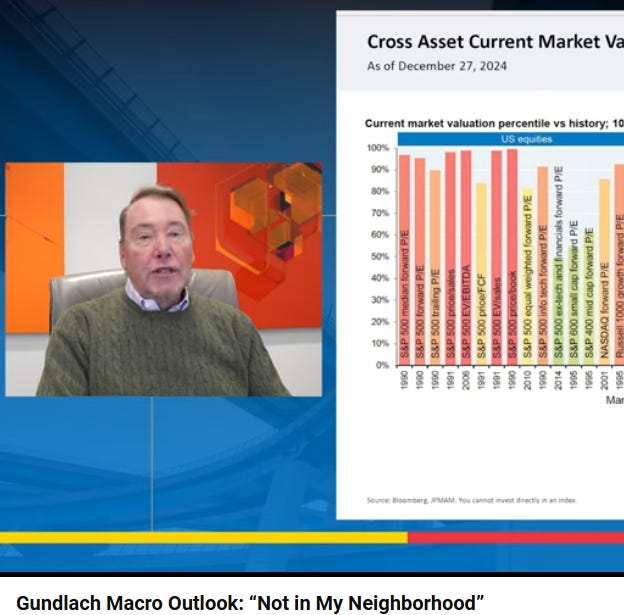
We also wanted to touch upon the DoubleLine webcast we viewed and share a couple of highlights. We highly recommend you guys watch this whole webcast, it is important to listen to what Jeff G has to say, we have followed him for decades and he is the best bond guy out there that we know. The first chart we want to share is the US dollar vs US 10 yield. The dollar has been under attack here for the last month and what this chart points out is the correlation between the US dollar and yields and with the US dollar falling, we should expect US 10Y yields to follow suit:
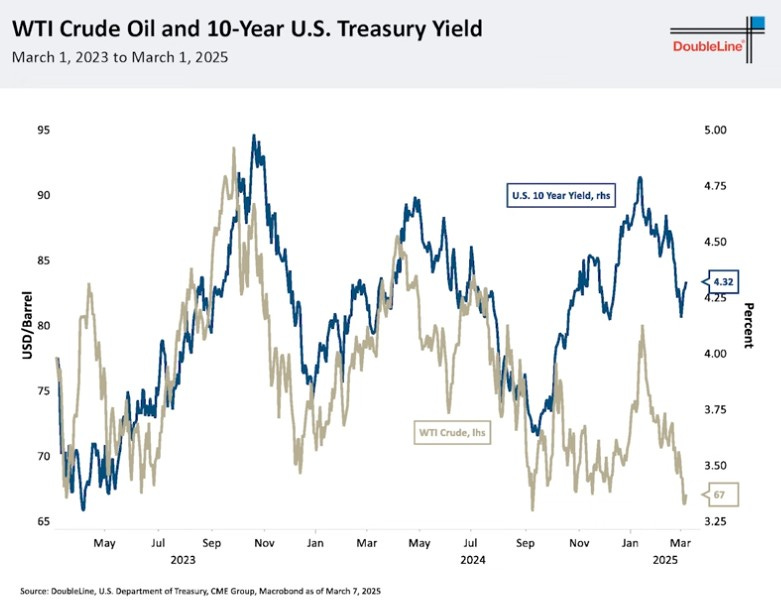
We also like this Crude Oil and US 10Y yield correlation and its pointing to the same lower yield trajectory given where the price of oil is:
Then the last chart is the spread differential of US corporate bonds higher risk (CCC) vs higher quality (BB) rating bonds. One thing we want to point out is how this spread was increasing (risk and volatility increasing) during the 2018-2019 period and we wonder how bad it would have gotten if all that Covid stimulus money wasn’t created. It seems even before Covid risk and volatility were starting to rise! Fast forward to today and we are seeing spreads bottoming out, indicating that we should see spreads start to widen out once again as risk and volatility increase:
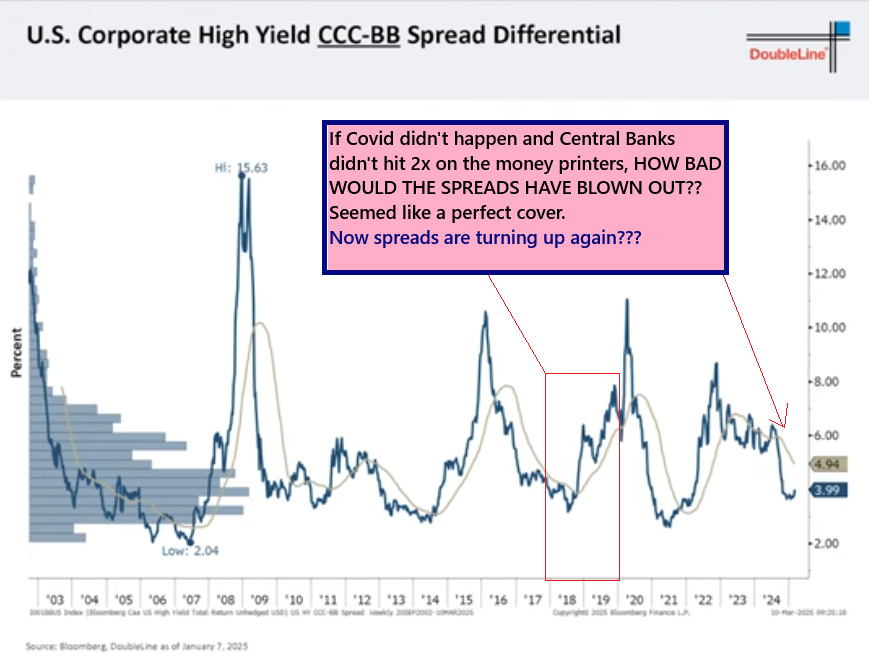
Credit those charts to the recent DoubleLine Total Return webcast with Jeff Gundlach which can be watched via YouTube, Here - DoubleLine Webcast
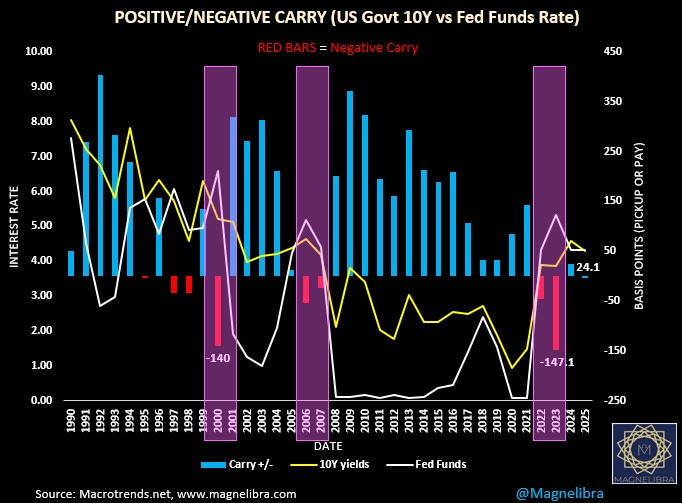
Here is a chart that we also share from time to time, it shows the difference in the yield of the Federal Funds (FF) rate and the US 10Y rate. When 10Y rates are higher than FF rate then this would be considered a negative yield curve or “negative carry” attribute. We have noticed throughout history that these negative carry years precede years of higher volatility and risk off generally. We narrowly averted a negative carry ending year last year but 2022 and 2023 where the markers we are using for today to indicate that volatility will increase here and perhaps we get a revaluation of equity and real estate, adding more fire to our thesis.
We also wanted to touch a little bit upon this Bitcoin Short Seller we keep hearing about and how the little traders want to band together and try to get this guy to bail. Well here is a little hint to the world, the large HFs that are using Tether to leverage up and short BTC have billions and you will lose. Here is the story from Unchained:
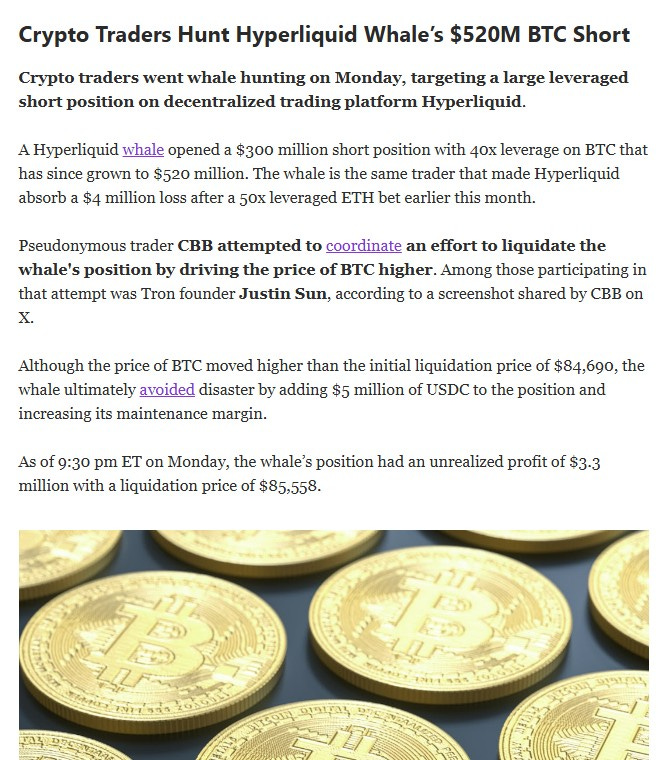
Here is the picture of this trader on HyperDash:
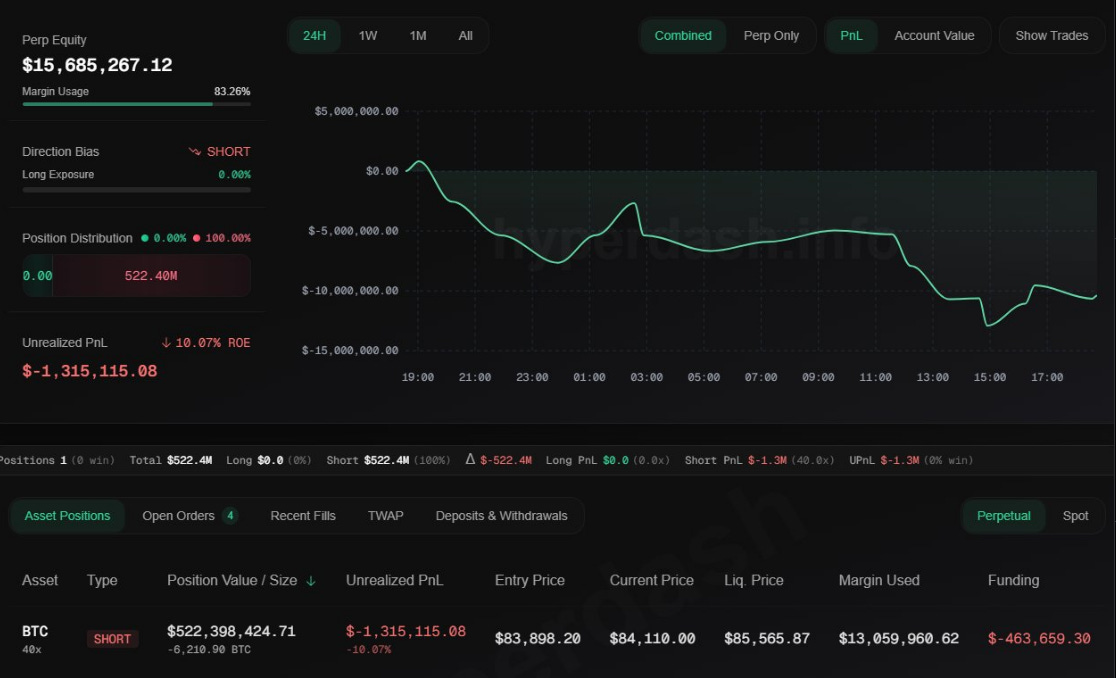
What this shows is that this levered short BTC player entered the position at an average price of $83898.20 shorting 6210.90 BTC. First off we don’t know the guys other positions, could be long futures whatever, so I never take this at face value, second we don’t know how many bullets a player like this actually has. We know large HFs will take this data and use it in their favor to push people around. In either case this is nothing more than Wall Street being Wall Street and the little guy will have zero affect upon getting a guy like this to do anything other than exert their will.
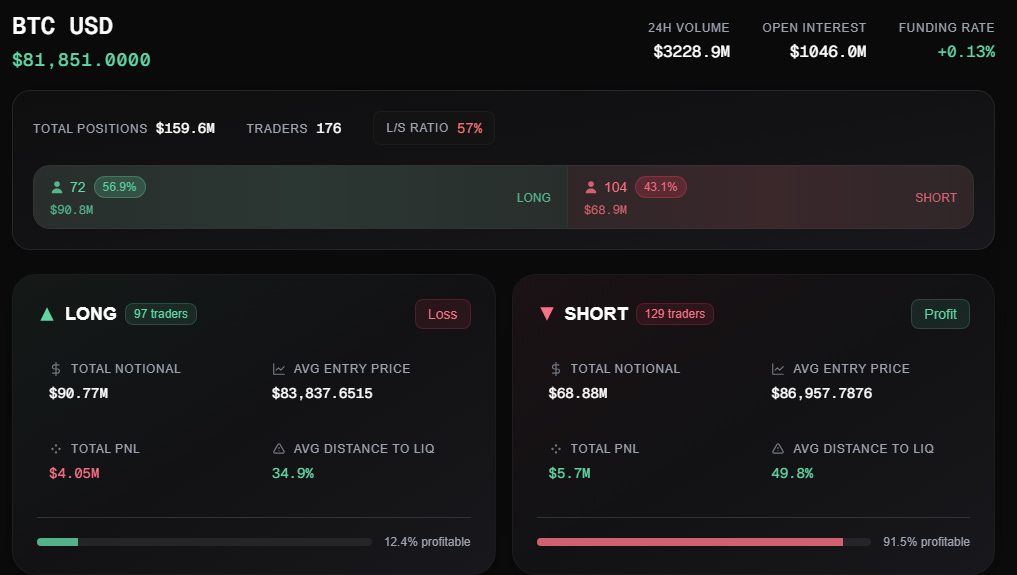
Currently the shorts shown on HyperDash have the upper hand here with BTC at $81851:
Ok now we will move onto the subscriber only data where we go through the proprietary data of all the global macro markets we cover. Our subscribers get our proprietary CTA markets sentiment tracker, they get our MEGA8s market cap tracker and our StrategyB covered call tracker where we track the Bitcoin purchases and equity data of StrategyB. We feel our subscribers can use our trackers to improve their own data collection, to improve their trading and investing methodologies and we believe you could benefit to! So please sign up and subscribe today!
Magnelibra Subscriber Data only sent in other new post.
Ok that is it guys, we hope you received our message well today! Please everyone if you can hit that subscribe button, share our work or at least give it a like. We are giving you a mindset that over time will greatly enhance your understanding of not only financial markets, but life itself. Thank you for giving us your time today, have a great day, change someone’s life, be kind, do something out of your comfort zone and realize, that no matter what, your attitude shapes your reality so always try to look at the positive side of things. Even if you feel the opposite way, just tell yourself, good, I am glad this happened to me, start saying that, start looking at everything is good. I can guarantee you, your mindset will start to see everything differently, Till next time, cheers!
Support directly to our BTC address: 3DvDvPnjwu5Fd6sagAYmiFXA2fPkjJf2cp


