

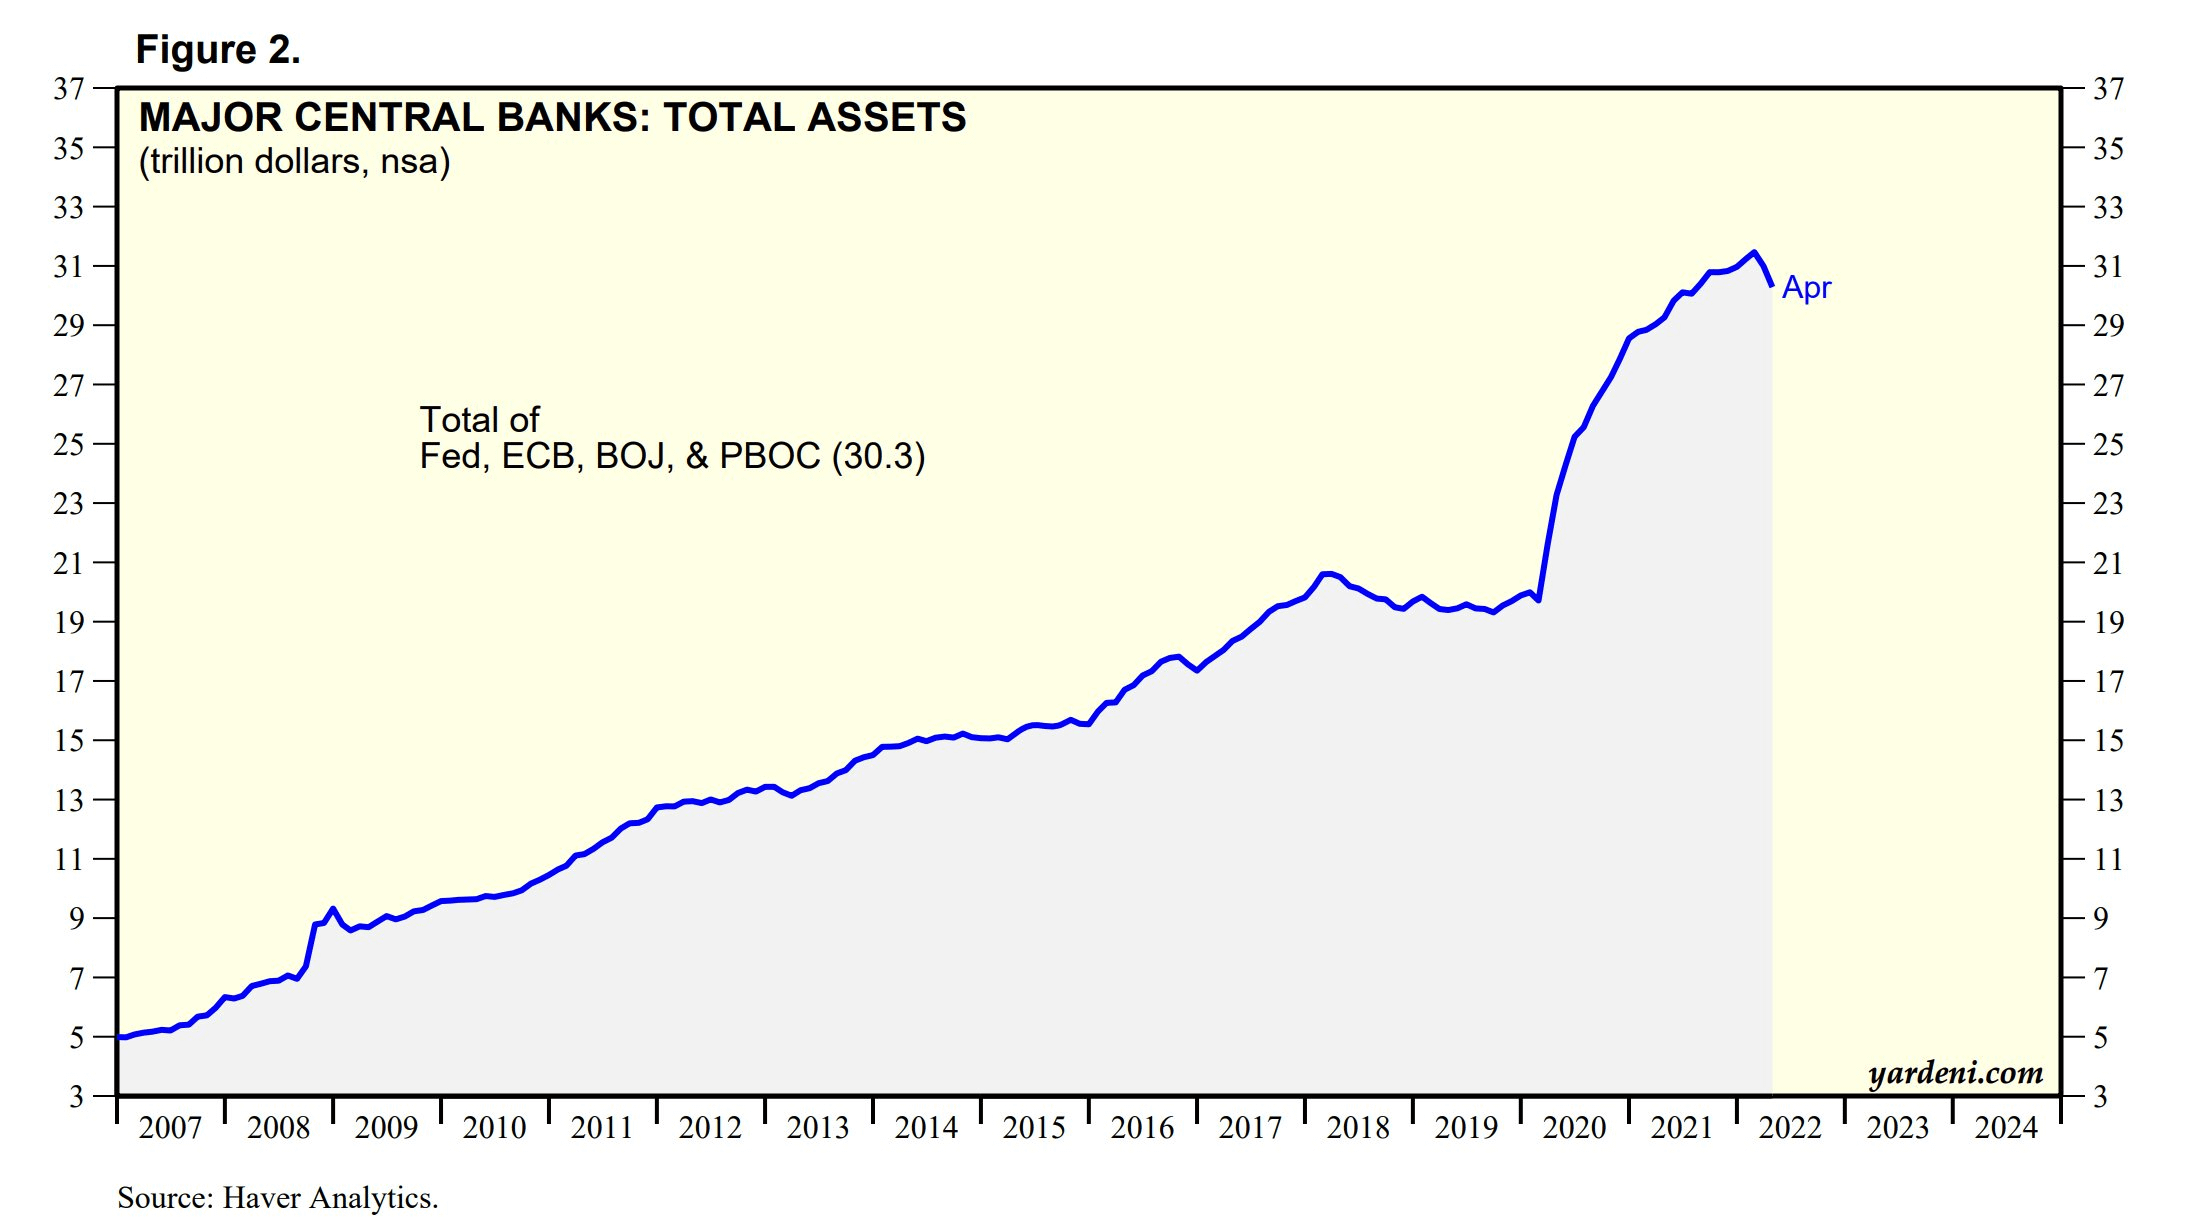
We just have a couple of technical charts that we want to share for this weeks trading but first we want our readers to understand something about the excess liquidity that is running rampant in our monetary plumbing. For those of you who don’t know, many years ago Magnelibra ditched all fundamental metrics of valuation for a more proper analytical measure, that is the size of the central banks balance sheet.
We say central banks because in general, we mean all of them. Despite the nation state status, each countries central bank works in conjunction with the other majors. Yes some may get along better than others, but you get the point or as George Carlin once stated famously:
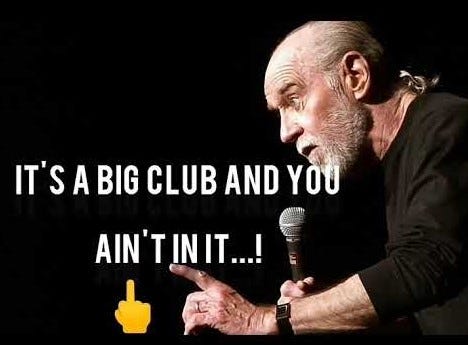
If the meme doesn’t hit home, here is a link for you George Carlin "Big Club" (foul language and content warning)
Anyway we were trying to figure out exactly what the FED has planned in regards to their rate hikes and QT operations. They know they can’t push too far, the risk will be asset price collapse. We also know their ability to control the price of oil or inflation is limited. However we also know this, the concentration of wealth since the FED and the other global central banks opened the spigot is at Serfdom levels:
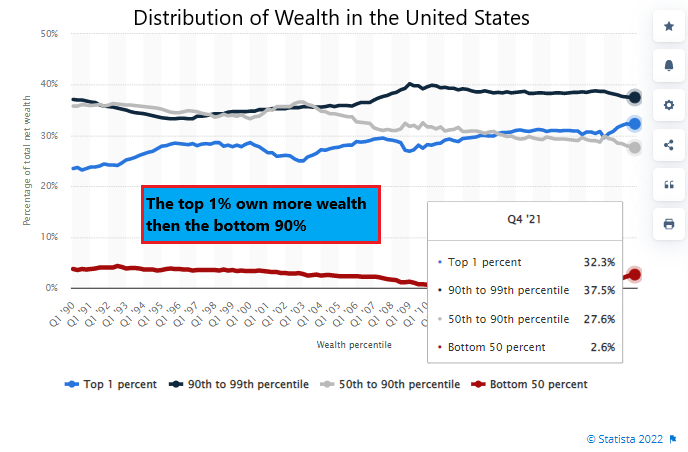
Its an obvious outcome given the fact that the Pareto Distribution is found throughout most of our important domains. Some will cite GINI coefficients or Lorenz curves but we know income is skewed and the wealthy have many outlets to reduce income via debt and other “outlets". So we would rather keep it simple and go with a standard 80/20 Pareto distribution.
In a more practical business sense, what it means in general is that 80% of a companies output is generated by 20% of its employees. So with this in mind we already know that the above chart is outside even this skewed parameter, because the top 1% own more than the bottom 90%. This is a problem and its leading to an artificial price chase where debt is becoming increasingly more utilized just to keep status quo. The reason this is a problem is because it will eventually lead to defaults, which leads to recessions and if we aren’t too careful, and if QE becomes impotent, well we will find ourselves in a depression!
The Federal Reserve knows they have some wriggle room though, they also know that removing liquidity in a fractional reserve system means it will be exponential. For every $1 removed, means we most likely remove $9 of leverage. Yes we know asset prices have been mega beneficiaries, but we also know there is a limit by which the FED can raise rates and by how far they can reduce balance sheets to. Inflation is not a surprise given this chart btw:
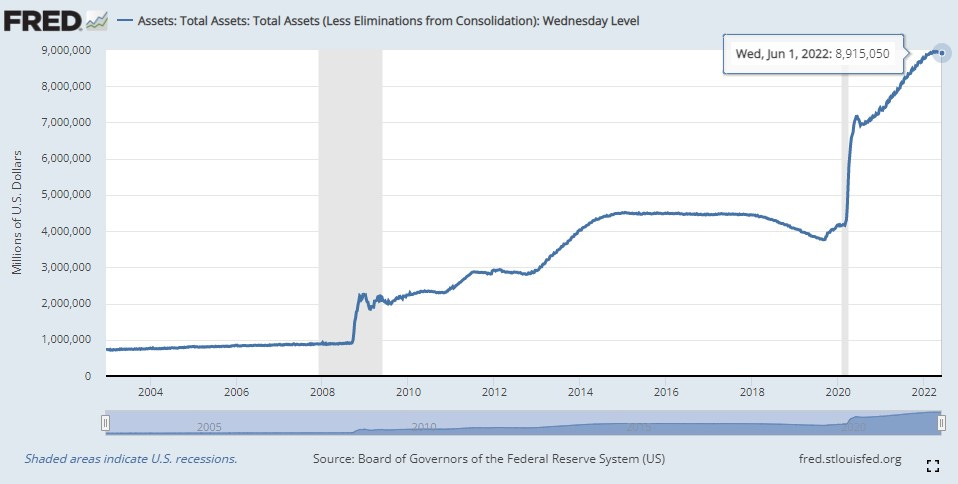
Magnelibra believes $7.8T to $8T will most likely stall the FED from going further, however when we look at the best excess liquidity measure (Reverse Repos) we know that $2T is the excess number:
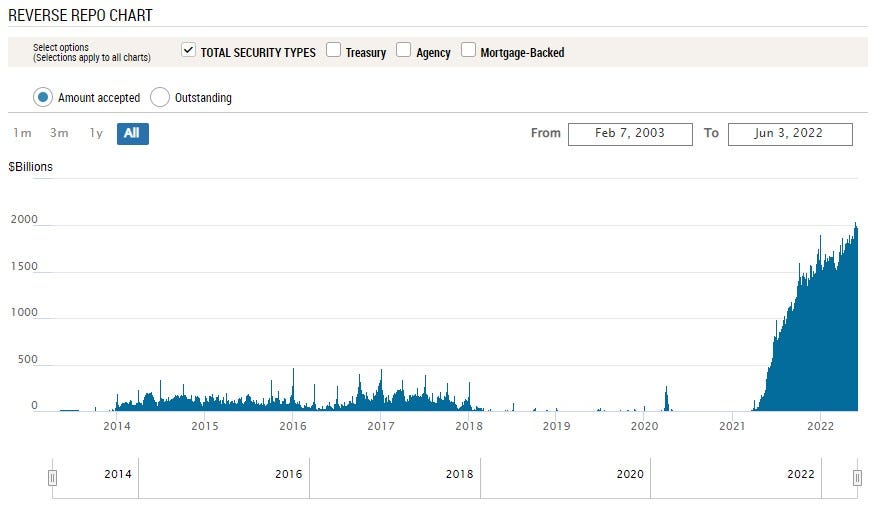
Basically from our purview, the FED has $2T to work with in regards to QT before seeing major repercussions. This number of Reverse Repos, is not a surprise to us, rather we know the participants have nowhere else to go with this capital…
So with all this in mind and with the FED basically the only guide to market direction, we believe the technicals will start to matter and when it comes to finding entry points in down markets, well let’s just say, you have to take risk, period!
We know in the long run that there are over valued points in time, and there are times when discounts can be had. Depending on your time horizon, you are best served to take risk and put chips on when there are pull backs and not buying into new highs. Well we have had a 20% + discount, some have put some chips back in, but many are still worried further downside is ahead. That is fine, downside is the risk, however in the long run, its about when you get in and at some point you have to take that shot and save powder for the next leg down to add on…that is how you do it.
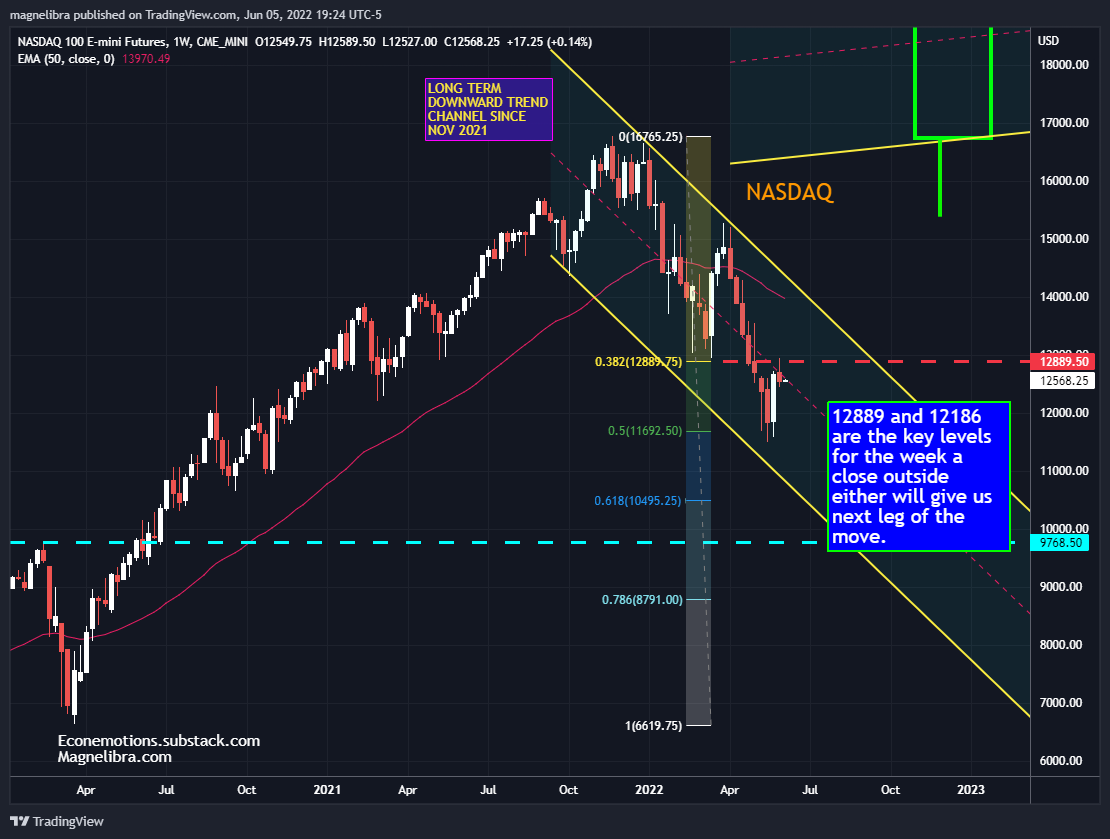
So let’s look at the technicals, first up the Nasdaq futures, we know 12889 is the upside hurdle and the 12186 will be our low key point to hold, a close outside of either of these on a weekly, will set the tone for the next trading leg:
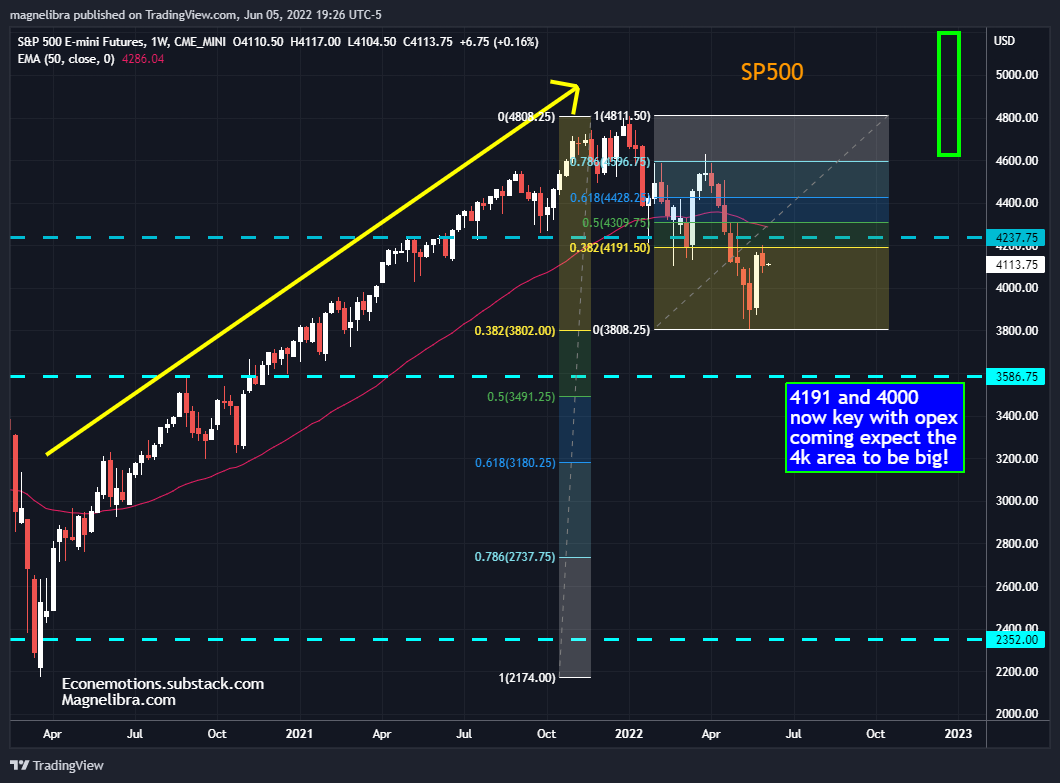
The SP500 has a similar set up, 4191 upside key, 4000 downside key and quarterly opex is coming, so we would suspect 4000-4200 as huge:
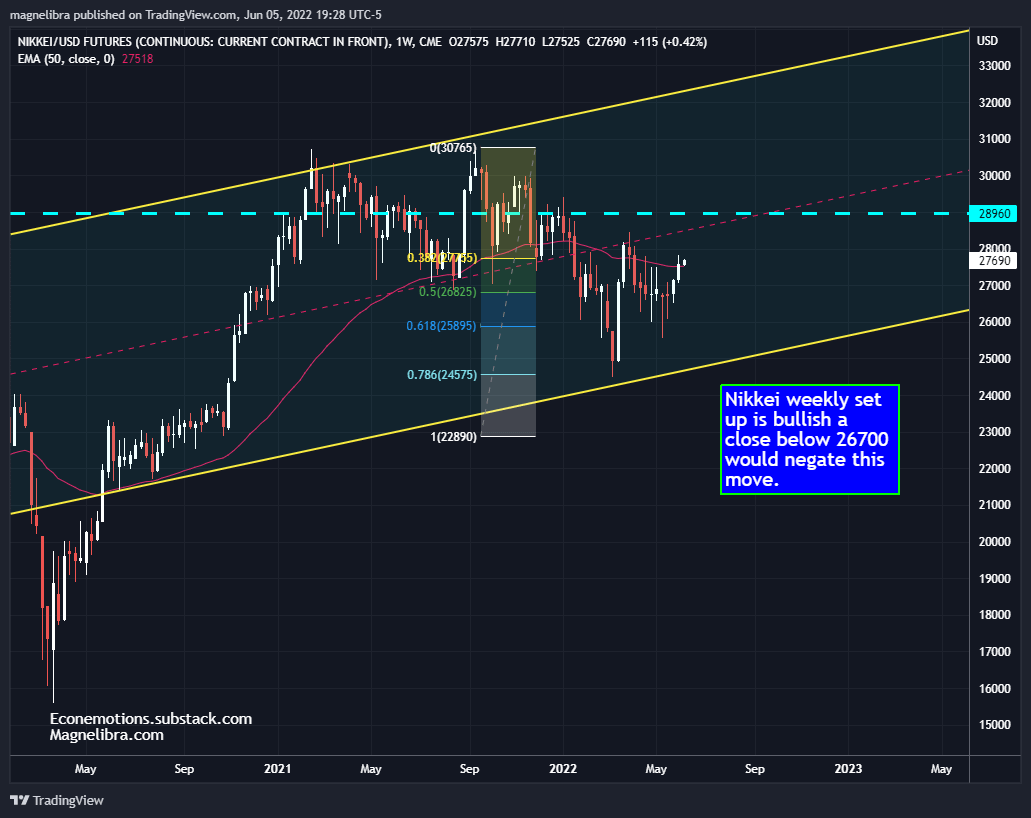
Finally the Nikkei, the Nikkei is putting in a bullish technical “W” bottom and looks a bit more bullish then domestic market technicals, but all in all the equities are trying to base out here:
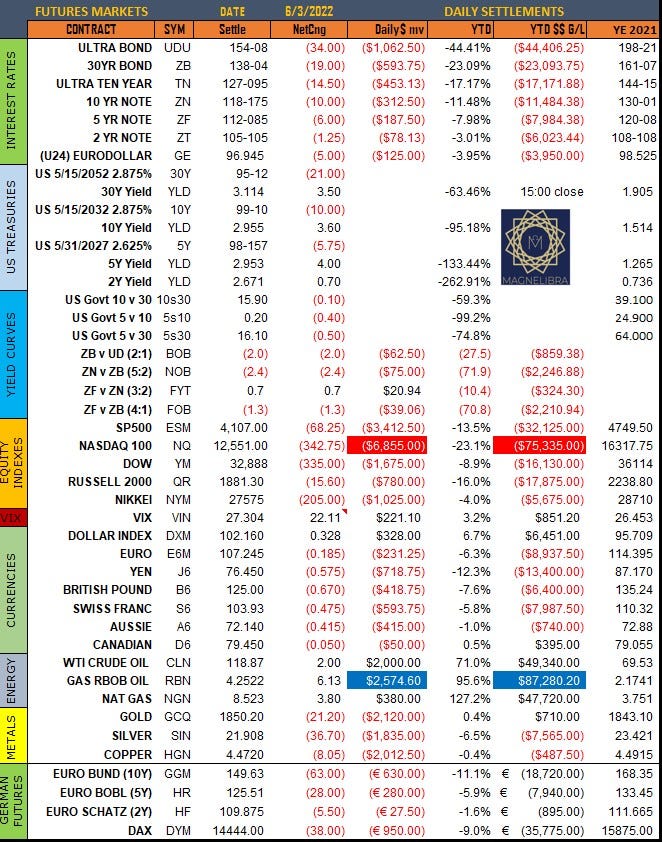
We also want to touch on Crude Oil, we know $122 is key, we would like to see a trade above that level and a close back below to solidify our exhaustive/reversal indicator, so keep an eye on that.
Now on to the settles from Friday June 3rd 2022:

Ok that is it, till next time…
***BONUS CHART***
So when anyone asks you why you may want to hunt for bargains, you might just bring up the fact that the global central banks will always print to raise asset prices and no the price of gas doesn’t really matter, it didn’t matter when it went to zero, didn’t matter when it was $140 and it doesn’t matter now. The reality of our system knows that energy prices are dynamic, what isn’t dynamic is the quantity of money, rather as time moves to the right, its always in an upward slope over the long run, you think this time will be any different???
DISCLAIMER: For educational purposes only. This is not a solicitation to buy or sell commodity futures or options. The risk of trading securities, futures and options can be substantial and is not for everyone. Such investments may not be appropriate for the recipient. The valuation of futures and options may fluctuate, and, as a result, clients may lose more than their original investment. Nothing contained in this message may be construed as an express or an implied promise, guarantee or implication by, of, or from the author Michael Agne owner of Magnelibra Capital Advisors. Magnelibra the CTA and its Global Futures Benchmark Program may hold long and or short positions in the various futures and markets that Econemotions covers. We will never claim that you will profit or that losses can or will be limited in any manner whatsoever. Past performance is not necessarily indicative of future results. Although care has been taken to assure the accuracy, completeness and reliability of the information contained herein, we make no warranty, express or implied, or assume any legal liability or responsibility for the accuracy, completeness, reliability or usefulness of any information, product, service or process disclosed.
ALL RIGHTS RESERVED 2022