

Alright, I just had to get this out there today because time usually gets away from me, but I am compelled to write especially given the quick turnaround in US treasuries and the recent drop in oil. So far this week the US bond market has decidedly turned the corner and rates have steadily fallen, the US govt 30Y yield was 4.744 last Wednesday and today its at 4.484. This is a hefty decline of 26bp, here is a look at the chart:
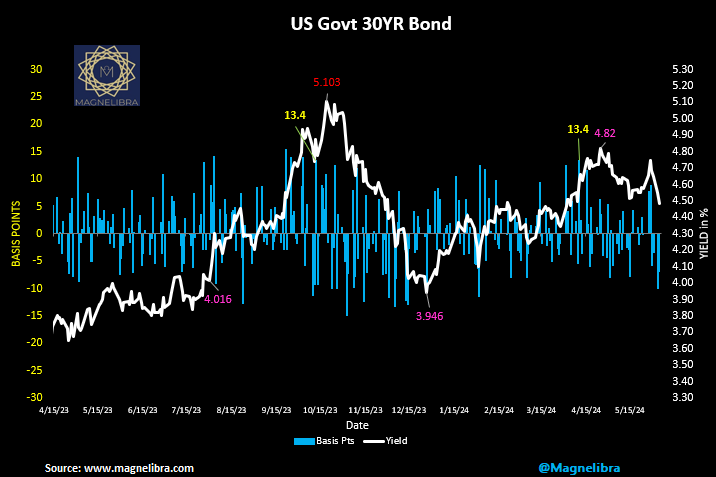
So we know the rhetoric, some 7 months ago the bond markets were pricing in the higher for longer mantra and the AI mania was just taking hold. Then inflation started dropping and yields tumbled in anticipation of a softer FOMC but then wham inflation stays persistent or has it? We know the skew in economic numbers has been heavily tilted toward a booming job market with monthly gain after monthly gain, but in reality the optics of it all are starkly different given the revisions and the absolute atrocious methodology when you look under the hood. Now we the economy has stalled out, prices remain elevated, but the cycle takes time to work out and we cannot withstand the higher rate leverage purge for very much longer. Yes the AI mania has driven speculative fervor to epic proportions, just like every mania does, but that has only run it course for now and is clearly out of the bag and in the late stages. Now we need to see the results. With it everyone seems to believe this will spring the innovation door wide open? Will it? Or will it massively increase productivity to where prices start to plunge in a deflationary death spiral whereby corps do all and everything to maintain their consumer edge?
Time will tell but for now, it seems that the US Bond markets smell a rat and yes, the US treasury has begun buying bonds again all the while the FOMC is claiming it can continue to shrink its balance sheet. We aren’t really seeing any shrinkage, ever since the FOMC balance sheet went from $4.1Tn to 7.1Tn in 2020, it currently rests right at that same peak from back then…yes it is down from $9Tn but keeping things fair, we are no higher or lower than 3 years ago, but we are some $3Tn higher than before Covid. That is your real source of inflation…the FOMC is good at this game, they have run at a 10% annualized asset growth rate clip for over 25 years!
So for all those thinking we are in this higher for longer regime, Magnelibra is here to tell you that it won’t be much longer…the table is set for the first negative non farm payroll print and rest assure the first rate cut will be shortly thereafter. Now we know another metric that has reached epic proportions and that is the rolling 3Y correlation between the SP500 vs the Bloomberg Bond index. Charlie Bilello put this great chart out today on X:
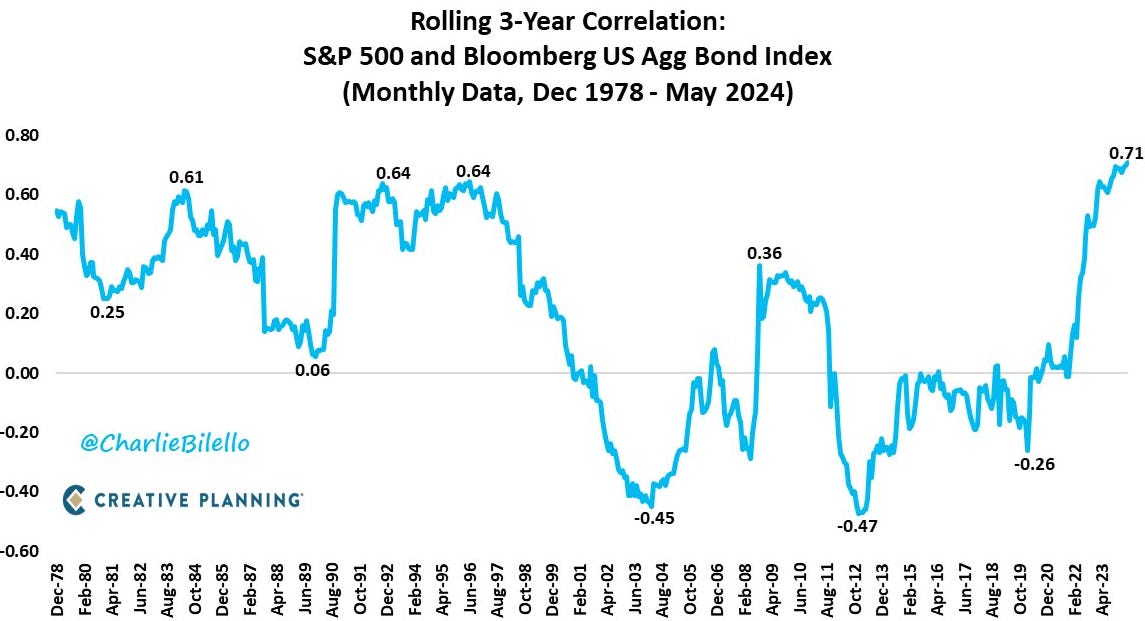
Some of you may ask what does this actually mean? Well it means that since we rose above that zero correlation factor its been increasing in a positive fashion meaning stocks and bonds have become more correlated. So what will turn this thing around? Well a softer economic outlook whereby equities are sold and the bonds become the flight to quality investment again. We get the higher inflation, you have to own tangible assets, we get it, but there are times where complacency seems to widespread and one asset is pushed to an extreme vs another and we believe we are getting close to one of those times.
We also know that the price of Oil has steadily declined and is down some 10% or so in just a week, this has our mind boggled considering the US has now basically stated that our weapons can be used to hit targets within Russia…historically not the kind of news that would send oil lower…but what it does tell us is that since breaking $78 we have gone down hill and the prospects for a weaker global economy seem to trump any war drums right now, not a trend we would fight!
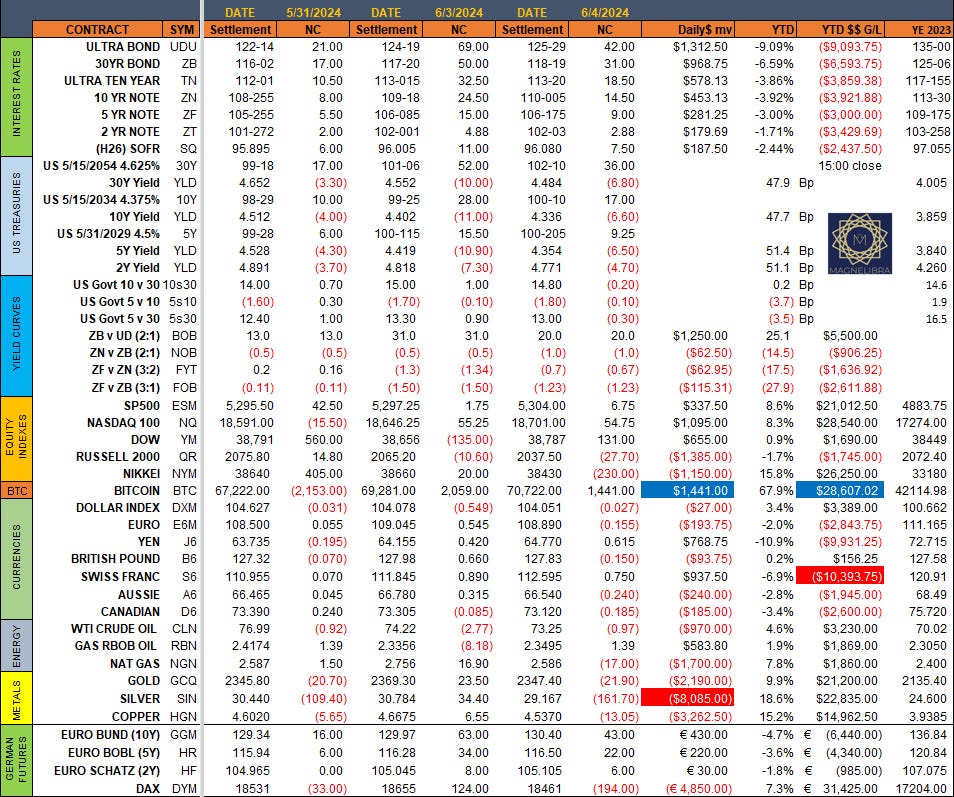
OK let’s look at the settlements page for this week thus far where bonds seem to be the big winner and energies and metals the big losers. The SuisseFranc strength has caught our eye and even lends more credence that global uncertainty is on the rise:
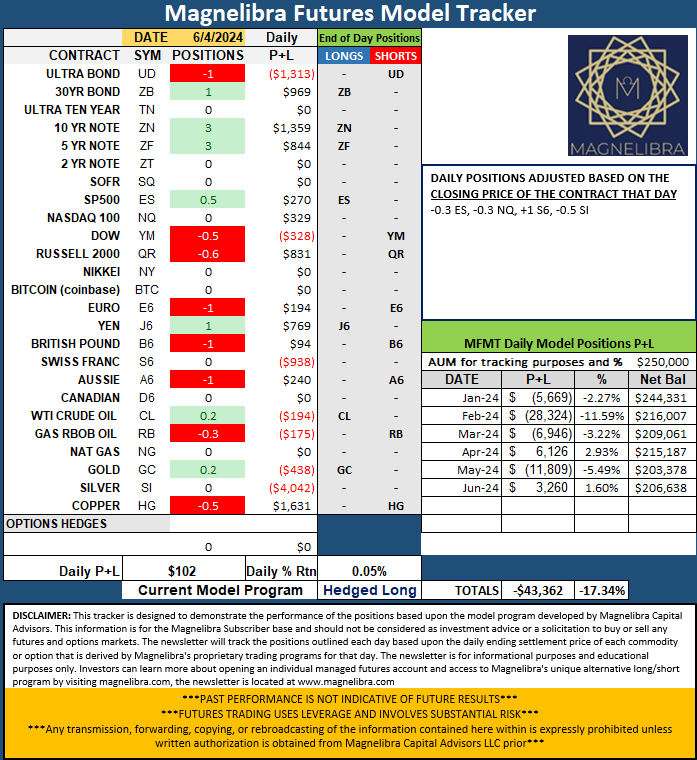
When we look at our Magnelibra Futures Model Tracker today saw some significant changes, as the tracker liquidated some positioning in the ES, NQ, S6 and SI markets so make note of the changes:
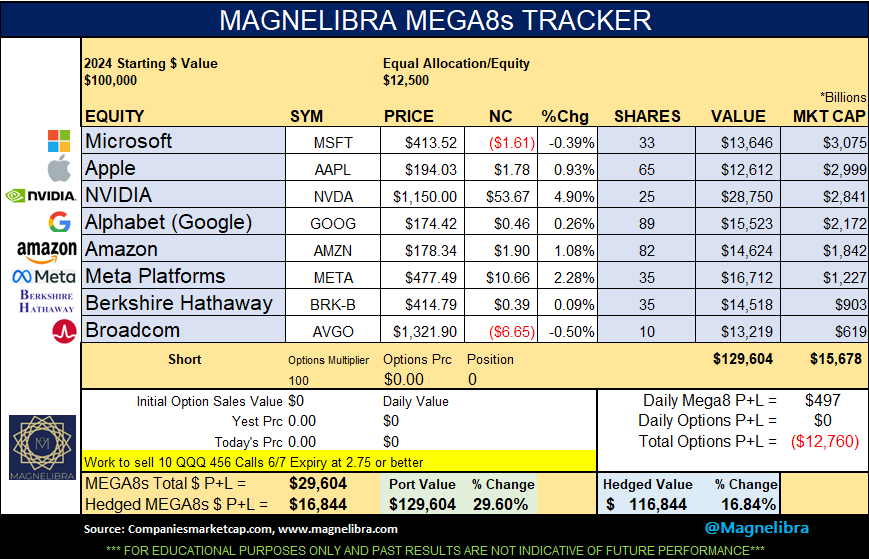
When we look at the MEGA8s Nvidia is gearing up to kick Apple out of the number 2 spot solidifying its AI dominance. Also note this weeks hedge is the 456 call in the QQQs at a price of 2.75 or better. We feel this is a good hedge before NFP on Friday, but don’t want to chase it down rather work a price that compensates for potential risk. That is the art of hedging anything, analyzing from all angles but overall you are hedging to protect certain risks. In this case, when you are long a static holding portfolio, buy static we mean directionally locked, in this case always long the basket. Well you want to hedge downside risk then. There are many ways to do this, we just show you one way to do it:
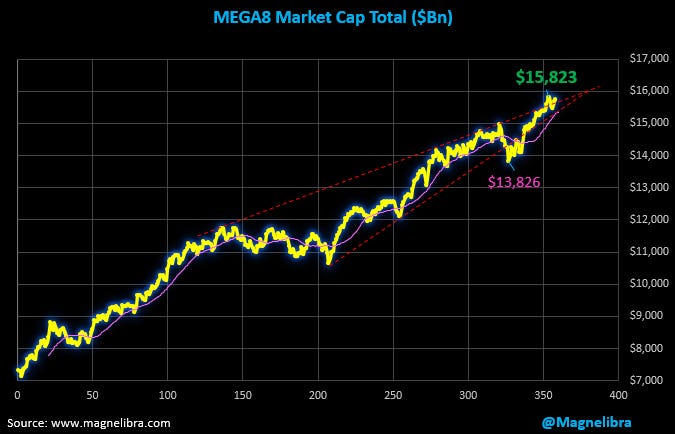
As far as the market cap chart of this group, its still in positive territory and has not broken down below any key MAs:
Ok that is it, we wish you all the best, keep your head on a swivel, stay the course and above all have a clear plan of execution. Set your goals, set them to attain a reality that you feel is obtainable and keep things realistic. Trading is more of an art form than a science, if it was programable from all facets then markets would cease to exist, there is not one fool proof way to do things, you have to do what you feel comfortable with, so that you understand things from a proper perspective. Not knowing is a bad feeling, yet we all can improve our game and our mindset, it takes dedication and practice, as well as conviction. Anyway have a great night and don’t get caught up in the narratives out there, think for yourself, uncover new ideas, explore all you can and test your limits consistently! Till next time cheers.