
Good Evening, Traders and Investors welcome to another edition of the Magnelibra Markets Podcast. Today’s episode #47 is entitled “What Truly Matters?”
Quick Disclaimer: The following podcast is for educational purposes only. This is not a solicitation to buy or sell commodity futures or options. The risk of trading securities, futures and options can be substantial and may not be appropriate for all listeners.

First off we wanted to acknowledge Memorial Day here in the United States and we wanted to dedicate this episode to all our fallen soldiers who dedicated their lives to protecting our great nation and solidifying our freedom to live our lives. So many have unselfishly sacrificed it all for a cause much greater than ones self and to them we are truly grateful. May God bless all of them and continue to watch over our service men today working behind the scenes to protect American values and our great nation.
There is a lot to get into so let’s jump right in and for many long time listeners we hope you guys analyzed Nvidia last week prior to earnings, where the options markets signaled a nice 8% move in the ATM straddles for week end. At the time Nvidia was trading $935 so an 8% move up or down meant a breakeven value of $1010 or $860. Well obviously we know now that Nvidia closed Thursday +$88.49 or 9.32% and further advanced on Friday closing near $1065. Nvidia is in a very unique position and we believe they will have to eventually make a decision to either continue to supply the necessary components to fuel the AI future, or delve into the markets that they are supplying, i.e. competing directly with Microsoft, META, Amazon, Google etc.
All we know is that their numbers continue to impress with revenue hitting $26.04bn up a massive 3.6x Year over Year. and above the $24.69bn estimates. Meanwhile data center revenue was $22.6bn vs an exp. $21.13bn and year over year that $22.6bn is a massive 5.28x! So you can see this stock is reflecting the massive drive and capital expenditures this arms race has led too. Not to mention they announced a juicy 10/1 stock split and rest assure, many will continue to plow money into Nvidia, not a battle we would dare short or get in front of, there is too much upside risk for this to continue.
We do believe that natural economics and technological advances will lead to new competitors entering the market place here to challenge Nvidia, when that does occur, then only then will margins and revenues slowly collapse and fall, but we are not there yet. We do believe we are entering a new shift in technological advances and AI is improving far faster than we can imagine.
The All in Podcast had some great points this week and it is always a must listen. They touched upon the OpenAI Scarlett Johansson saga, by which Sam Altman contacted her to use her voice for their new AI chat bot. She declined to take the offer to use her voice, and last week OpenAI put out the voice “Sky” which does sound like a digitized version of SJs voice. Well this is going to be an ongoing problem in the AI future by which anyone and anything will be digitized. Perhaps OpenAI is doing this on purpose, trying to get a judgment in favor of their ability to digitize any likeness no matter how close the similarity. What this would do is set a precedence win for AI digitization in the future. Will see what happens, but this is just the beginning.
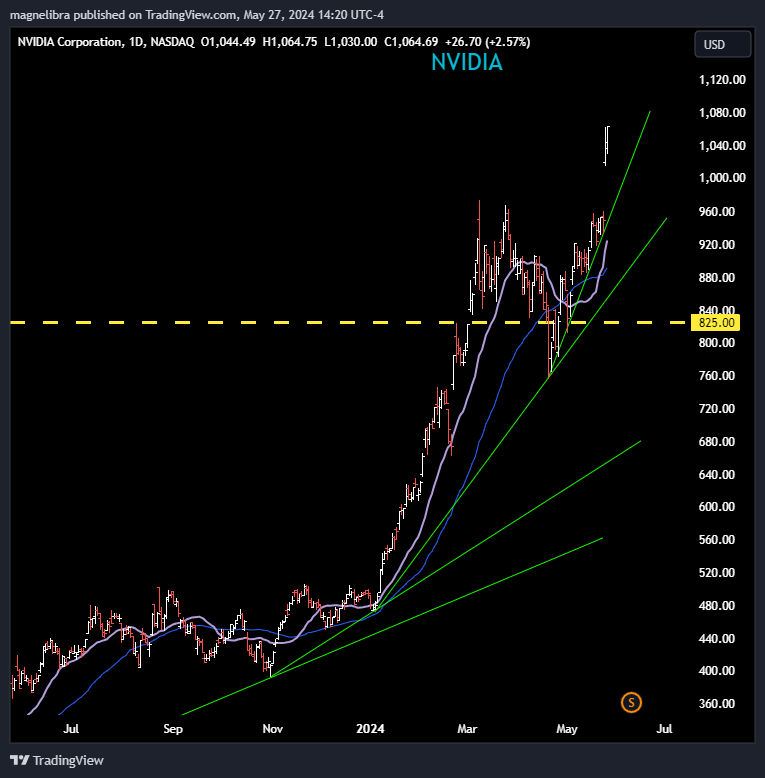
Anyways as we stated we like the prospects for Nvidia to continue and money is being heavily concentrated in the equity and once the stock splits, rest assure this will drag even more players in the mix! As far as the stock chart, well, its a breakout but doesn’t mean we can’t have some back and fill here. We have levels that we know underneath that would indicate weakness and our span lines below show those levels below:
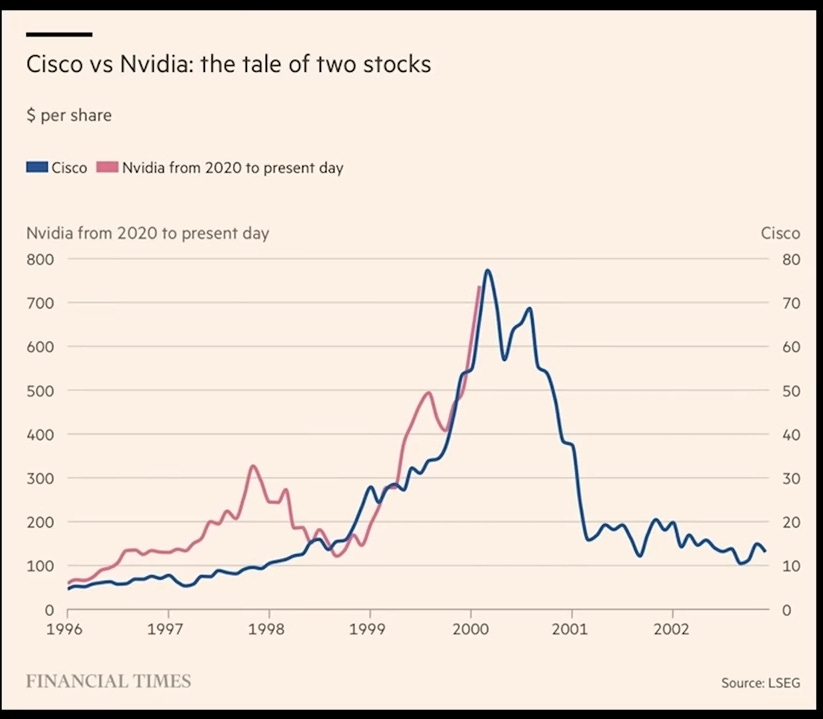
The All in Podcast shared this chart comparing Nvidia to Cisco, I never like these comparisons, especially in price per share. It is fun to plot and build a narrative but we do not believe it is an analog for speculating but thought we would share it anyway:
Alright let’s move directions here and lets touch upon the current state of our economy and where we believe it is at. Yes we know the stock market is higher, but what you guys all need to realize, is that the stock market has more to do with hoarding and capital base structure building then the general well being of the economy. Do not compare the well being of our economy with the actual consumer sentiment or breadth or strength of the underlying data that derives our economic total well being. We believe the equity markets since basically 1998 have not been a good measure of the strength of our economy. Many long time listeners know that Magnelibra focuses upon the supply of money or reserves and interest rates. We have spent over two decades as interest rate arbitrageurs in the highly liquid US treasury markets. We consider ourselves experts in the area of interest rate risk, hedging and yield curve strategies. Let’s just say this is our wheel house. Even with this expertise, the fact that the FOMC has kept rates this high for this long means one of three things.
Higher interest rates are required to compensate investors in our paper for risk
The goal is to destroy excess leverage in the Commercial and Residential real estate markets
This is stealth QE because the US govt is transferring trillion plus in risk free interest to investors, assisting in buffering realized losses in other areas especially commercial real estate.
These are the things we are focusing on, but in reality this is a major penalty for the common individual because not only are prices crushing household balance sheets, but the cost of credit is at decades high. Now flip this to the millionaire class and its a different situation, its a way to increase risk free interest pickup. This bifurcation is not an ideal situation for long term social stability, eventually the bottom 80% will require things to normalize or else the very fabric of societal cohesion starts to breakdown.
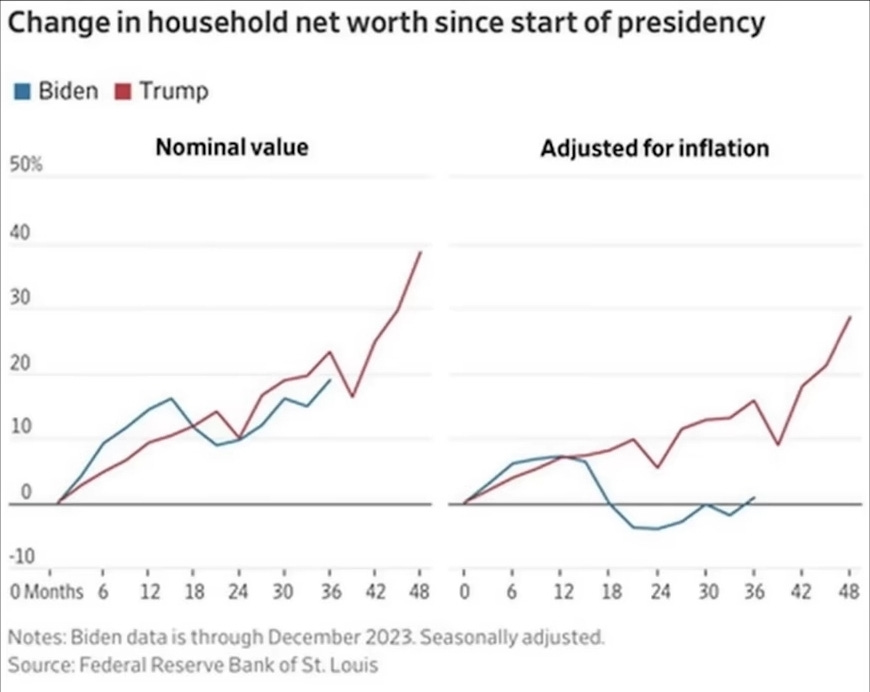
This next chart poached from the All In podcast outlines how over the last 4 years the adjusted change for inflation in household net worth is barely above zero. Zero growth due to the cost of inflation, this chart has nothing to do with one president over the other from our viewpoint, rather points out the fact how inflation devalues net worth:
Now what we see happening is that the real economic data starts to show up and the FOMC is forced to cut rates. You guys know that time comes when non farm payrolls turn negative, so until then, yes equities can remain elevated but that is the shoe we are awaiting to drop and once it does, we know the first FOMC cut will be near.
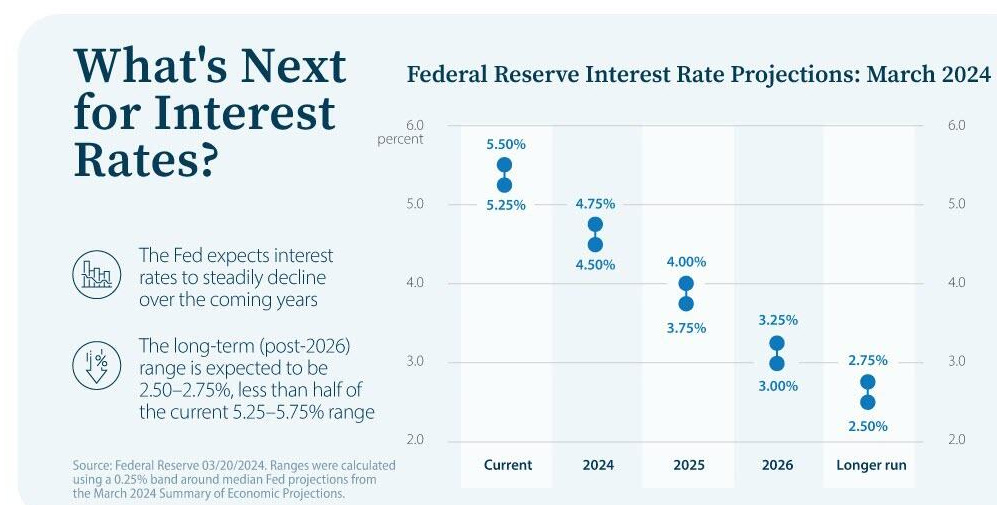
As far as the expected path right now for interest rates here is the linear path brought to you by Yahoo Finance, however we know this will not pan out this way, the cuts will be steeper and faster than what this path indicates:
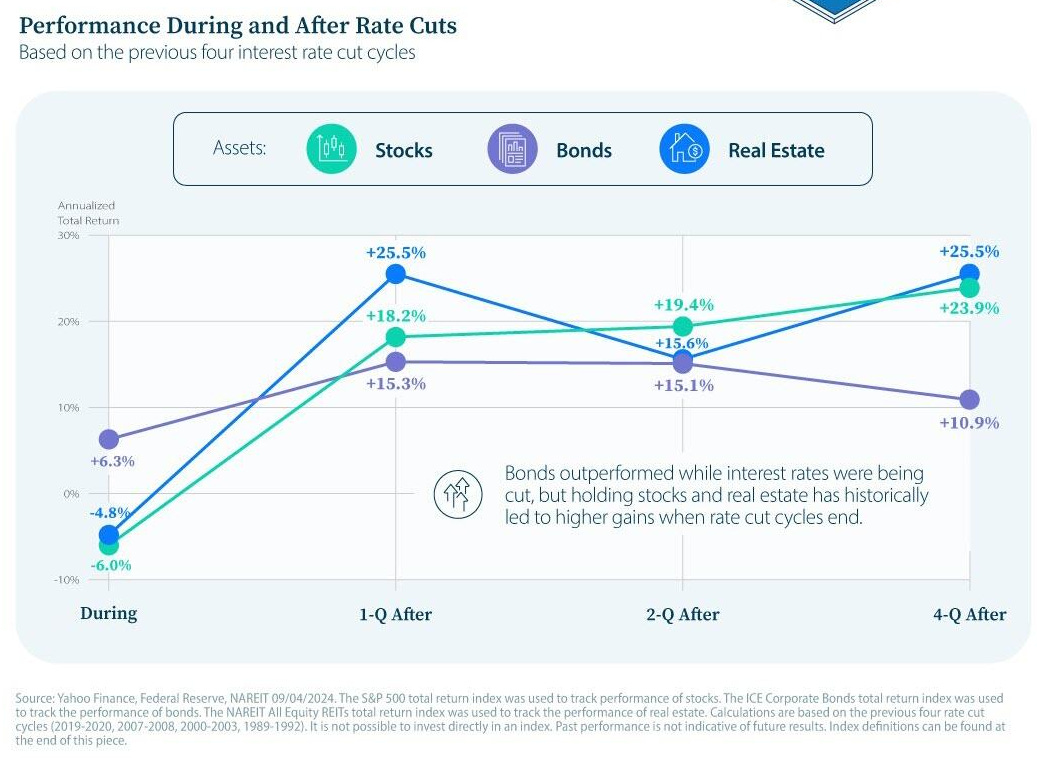
We also saw this great graphic in the same Yahoo Finance article outlining the returns post rate cut:
Another chart we have seen that gives us some serious cannon fodder for a major downturn in real estate is this next one from LongTermTrends. This chart shows that home price to median household income is at record proportions, even well above that of the housing bubble during the GFC:
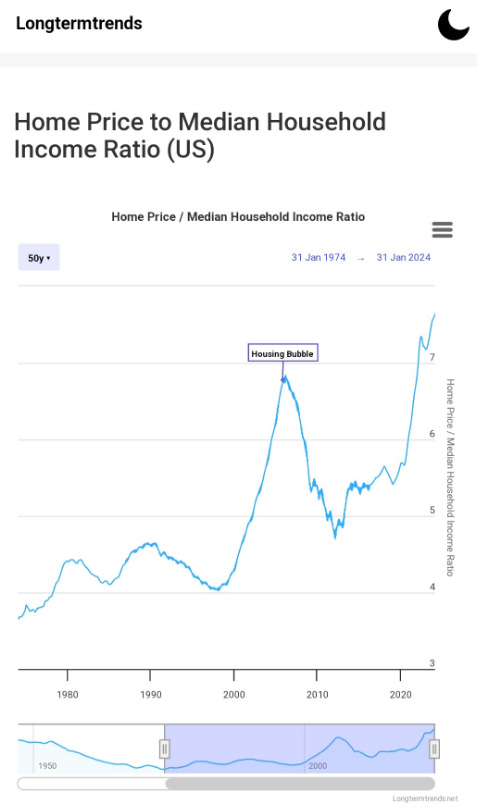
Now people will say, how do home prices continue to advance, well this is a product of migration for one and also a product of conglomerate buying of real estate, investment homes for rentals etc, but how long is this sustainable? Once again, once we get negative non farm payrolls well this will start the tsunami of homes hitting the market, prices falling and foreclosures etc…this stuff is very cyclical.
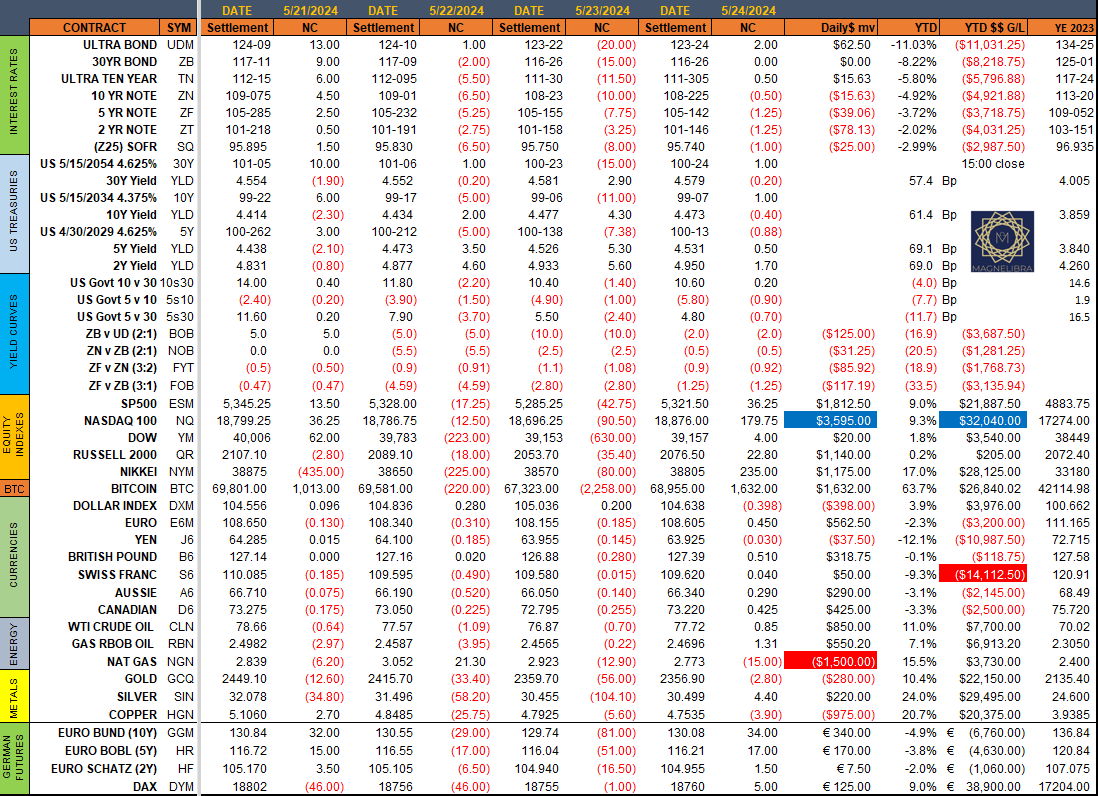
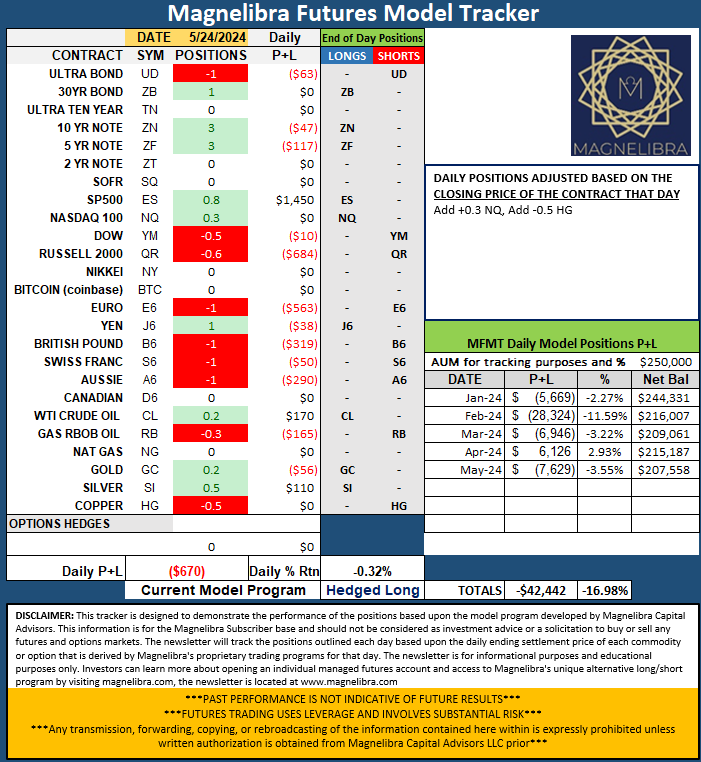
Ok let’s get into the market data from last week, here are the settlement data points from last week, there wasn’t much change across the board in the markets we cover from the prior week other than we noticed that the new highs in metals were being sold into, will it continue this week we aren’t sure, but definitely some profit taking has occurred:
When we look at the Futures Model Tracker last week end of week changes include an addition of a long NQ position and short copper position. The NQ position was based on a weekly close above 18850 but the sensitive of this position means a daily close back below 18650 would close this long out:
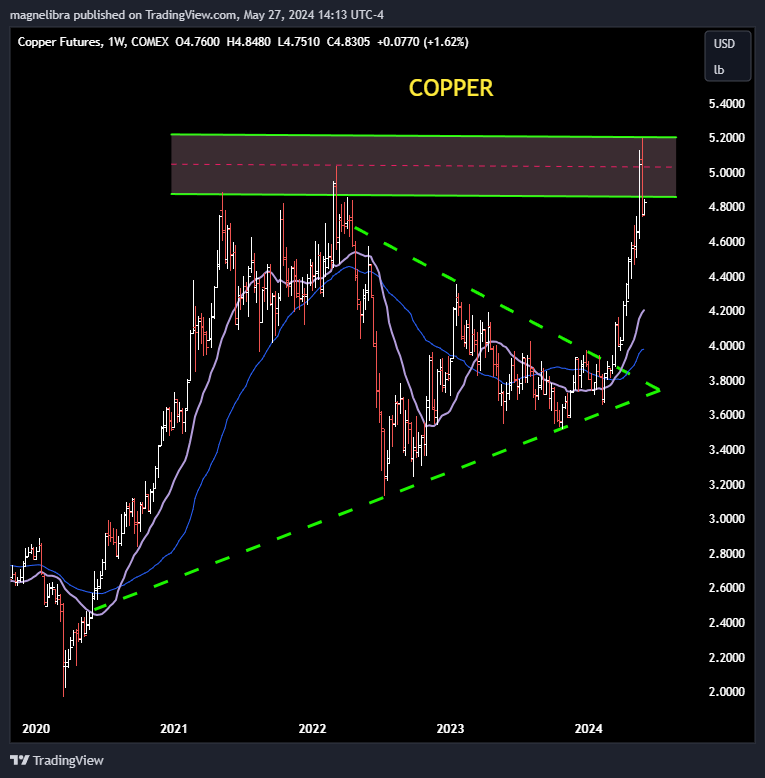
As far as a few technical charts in regards to some of these markets, let’s look at Copper first. This area has seen a failure back in 2022 and now once again is threatening to thwart the copper advance:
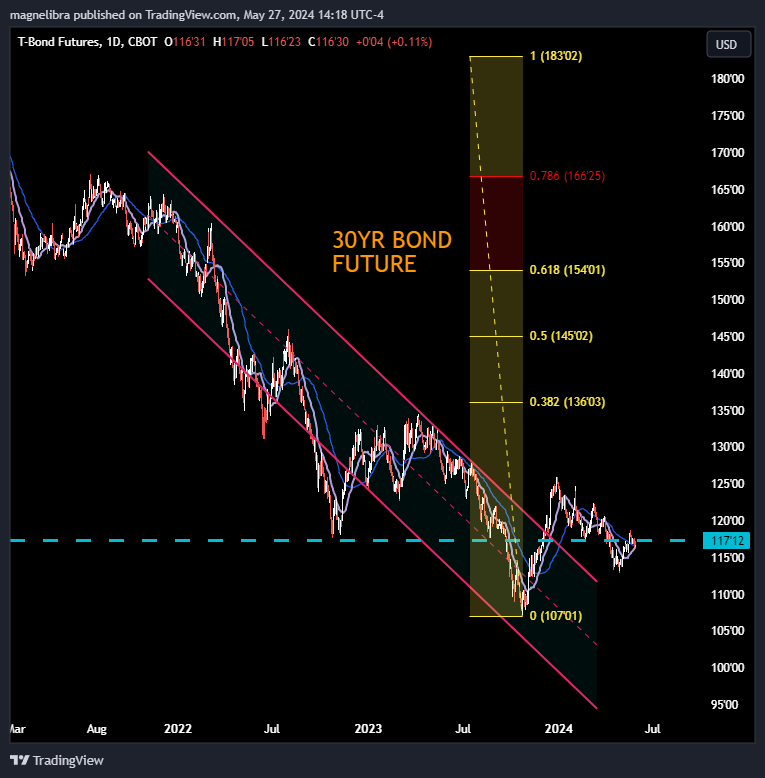
When we look at the US bond future its been sitting at our longer term median line, for us we either start to price in lower rates here now or it risks a further collapse down and puts the FOMC in a very precarious position, we will opt that the bond future will rise from this area:
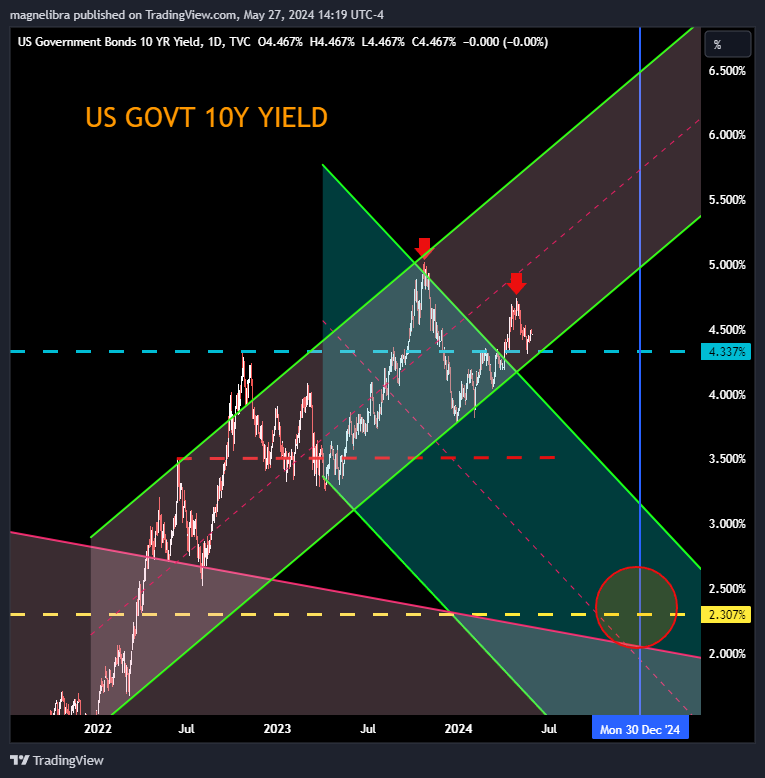
When we look at the US Govt 10Y market, not the futures you can see our 4.337% level is our line in the sand here. We would suspect a move down below this area will accelerate with lower non farm payroll prints:
Now let’s take a look at Bitcoin. We know that the $70k level has provided a substantial headwind despite the continued ETF interest. So let’s look at this chart of ETF institutional interest:
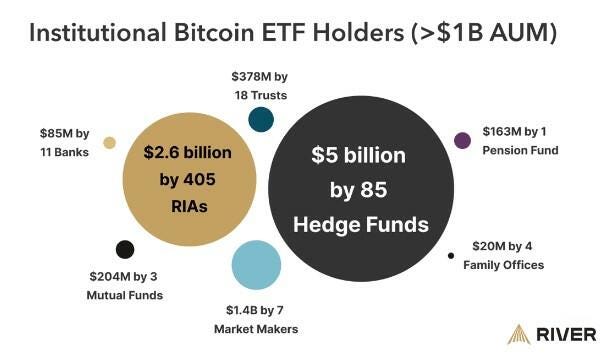
The thing we want you to focus on is not that the institutions are involved but rather that they are buying a derivative share of Bitcoin and not owning Bitcoin directly or cold storing it, there is a significant difference. Just like buying GLD the ETF is not the same as buying physical gold. Yes it is an allocation but honestly is it long term hodl type capital? Will the money sell if the overall risk markets start to fall? We do believe they will and this downturn will test the resolve of these holders. We haven’t had a typical Bitcoin sell off so when we get one, then we will know.
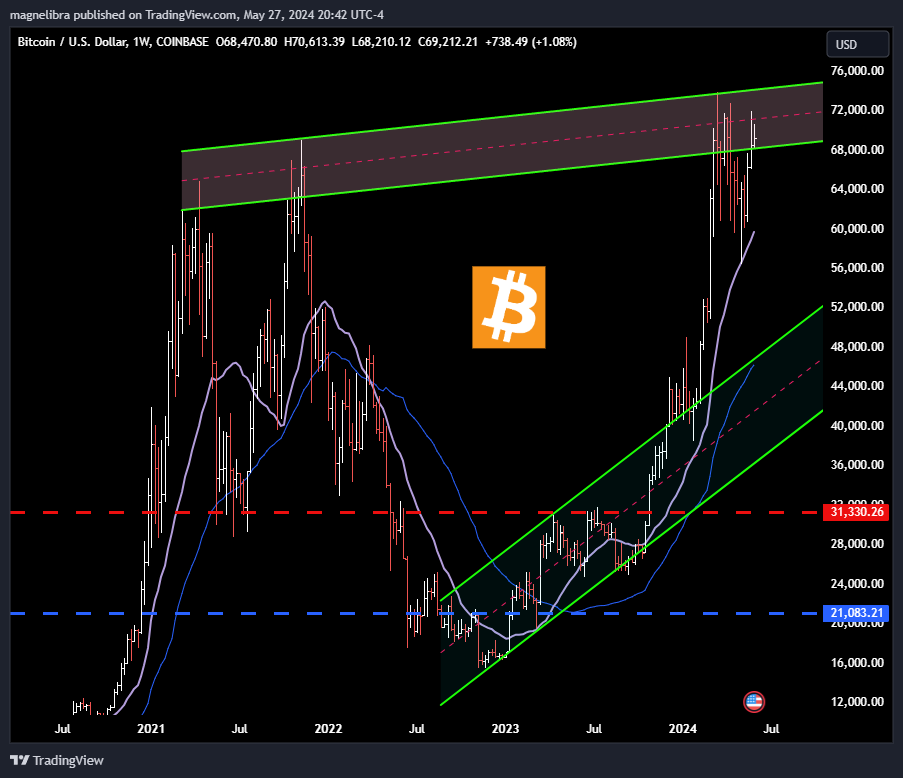
As far as now the technical chart, and for those that don’t believe Bitcoin is being controlled by the institutions, well one look at the technical 21pVWMA and the recent bounce…yes even mechanical bots are pricing Bitcoin. The bigger issue here is that the consolidation around this level can be a spring board or a major rejection and one way or the other our parameters for up or down are clear:
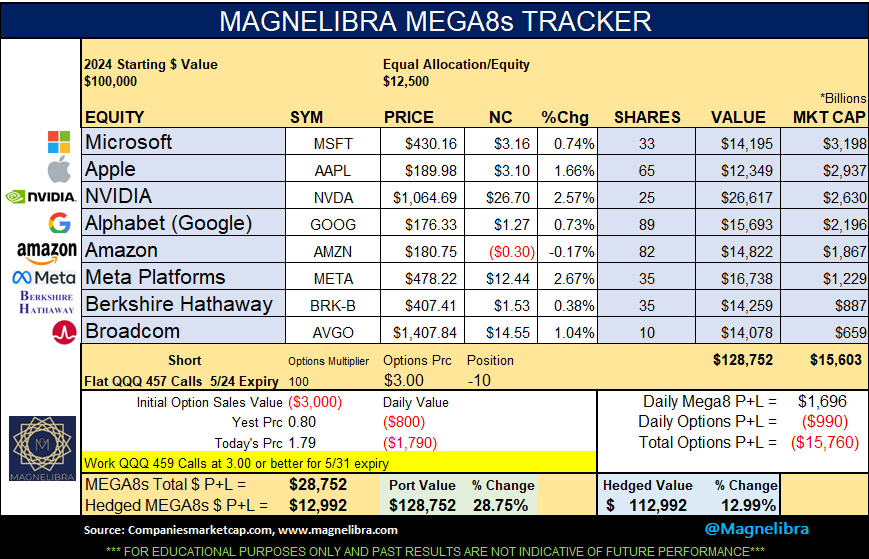
Ok let’s move to the Magnelibra MEGA8s which show the grouping on the heels of Nvidia posting another market cap high. Last weeks hedge did assist the hedged value a bit and for this week we target the 459 calls at 3.00 or better. We will continue to provide you with what we think would be an appropriate hedge for a static long portfolio like this. There are many ways to hedge a book like this and we are just demonstrating one way for you to follow along and learn:
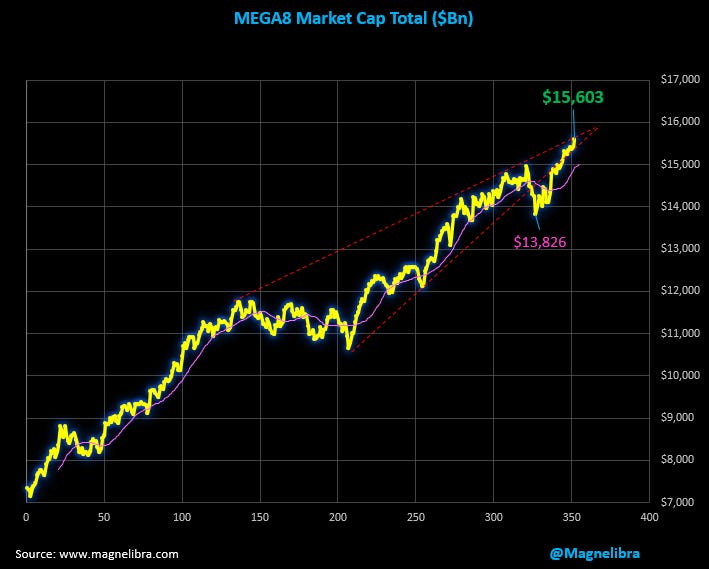
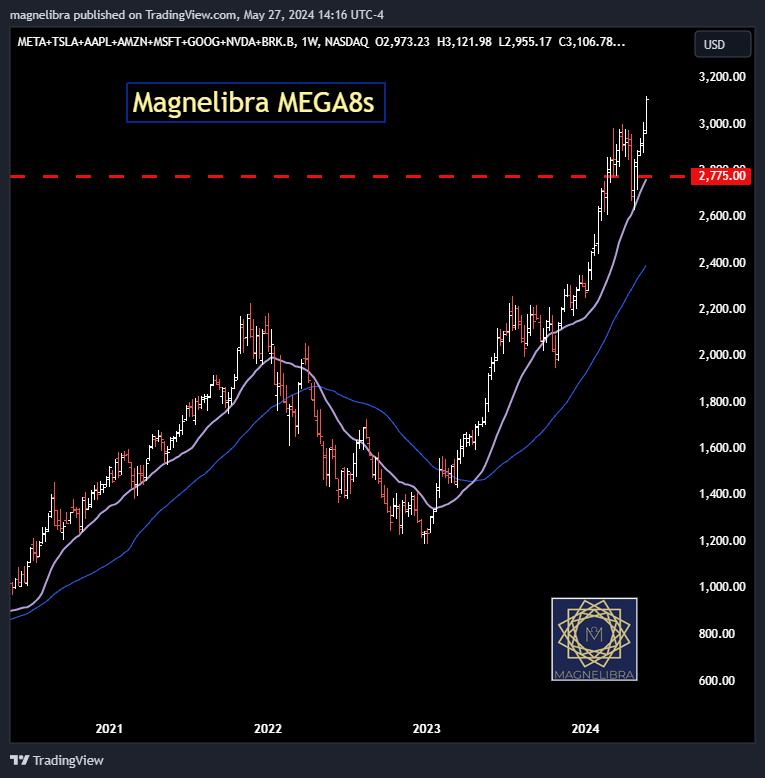
Here is the total market cap chart for this grouping and to say its coiling is an understatement:
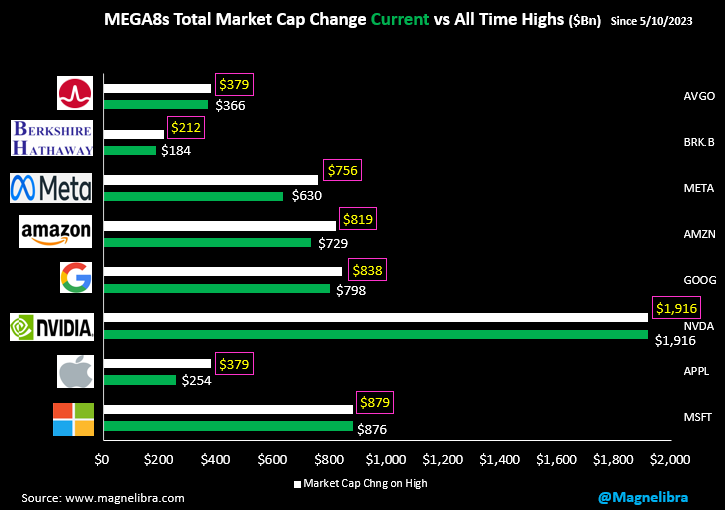
Here are the individual components with Nvidia adding $1.9Tn in market cap in a little over one year, truly amazing:
As for the Magnelibra MEGA8s technical chart well new highs of course:
Ok that is it for today, we hope you learned something from today’s episode and try to incorporate a little bit of our expertise into what it is you are trying to accomplish. There is so much narrative out there and we try to cut through all of that to provide you with analysis that can only come from 20 plus years navigating these markets. We have been through many cycles and the one constant that drives them all has been the Federal Reserve and global central bank monetary policy, we hope our insight better explains their influence so that you can better understand how and why markets move the way they do. We hope you subscribe to support our work, we hope you share it at the least and till next time, we wish you all the best in all of your endeavors. Cheers!
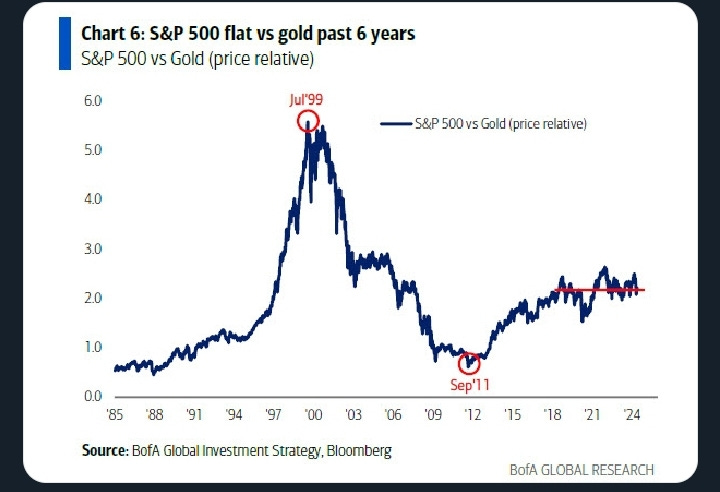
Bonus chart, just to demonstrate how gold works in a debt monetary system…this chart is actually shocking given how much its deflated price gains of equities.