Leadership Handoff: The SP-NQ Spread Turns
QQQ back on 685, NQ support gone, and a spread we have not seen turn like this since late 2024. #MustRead for all our free subscribers

SECTION I This Week’s View
Equities disappointed this week. The bull leg since April has been carried by seven or eight names doing all the heavy lifting, and by Thursday the weekly NQ tape had broken its 28,150 support and closed below it. That is a change in character, not a routine pullback.
The second-order concern is what we do not see on the balance sheet. AI capex is being financed through structures that keep the true cost off the reported number. Circular vendor financing, unusual off-balance-sheet vehicles, and rising energy commitments are all real cost lines that will eventually surface. The equity market has not been asked to price this yet.
The signal we are watching most closely is the SP500 vs Nasdaq futures spread. That is the standout call this week, and Section III covers it in detail. FOMC meets next Wednesday. This is the setup.
SECTION II Equity Focus: The Setup
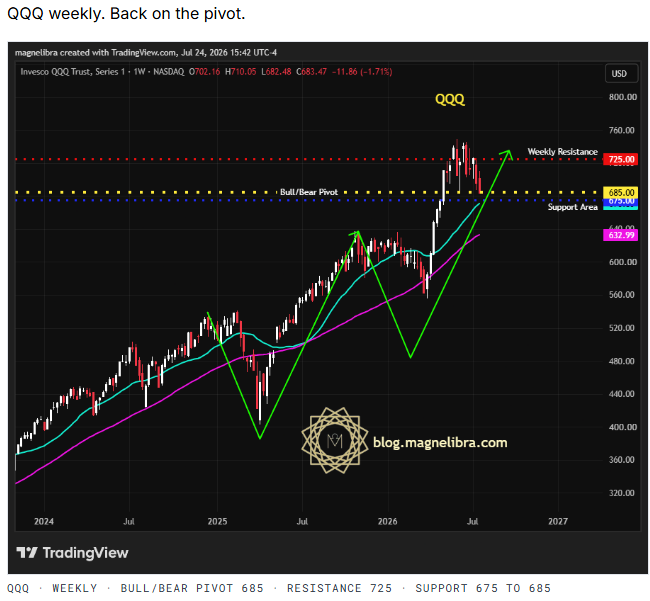
The QQQ weekly closed near 684, below the 685 bull/bear pivot. The 725 resistance held on the last attempt, and the 675 to 685 support area is now the line in the sand. This weeks close seems to be forcing the issue of a further probe down toward 633 area where the 200p weekly MA resides
NQ futures weekly. Support broken.
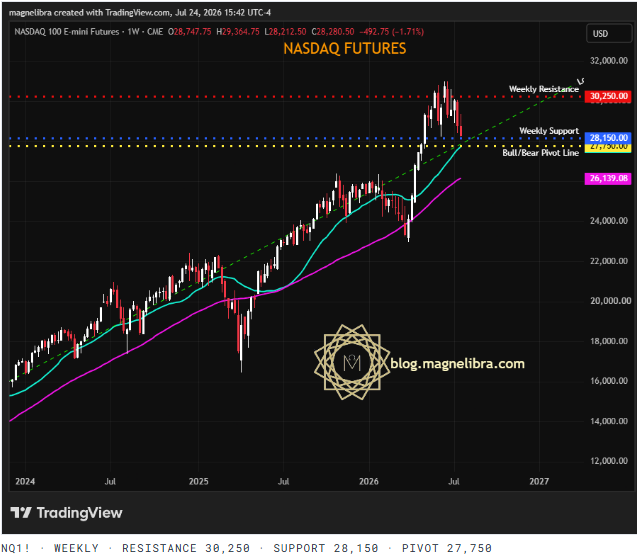
NQ futures are the cleaner tell. Weekly resistance at 30,250 held twice. Weekly support at 28,150 broke this week, and the tape closed at 28,282.25. Bull/Bear Pivot Line at 27,750 is the next test. Under that, 26,139 comes into play. The 50 and 200 period moving averages are still rising, but the price is now leading them down.
SECTION III The Standout Call: SP vs NQ Spread
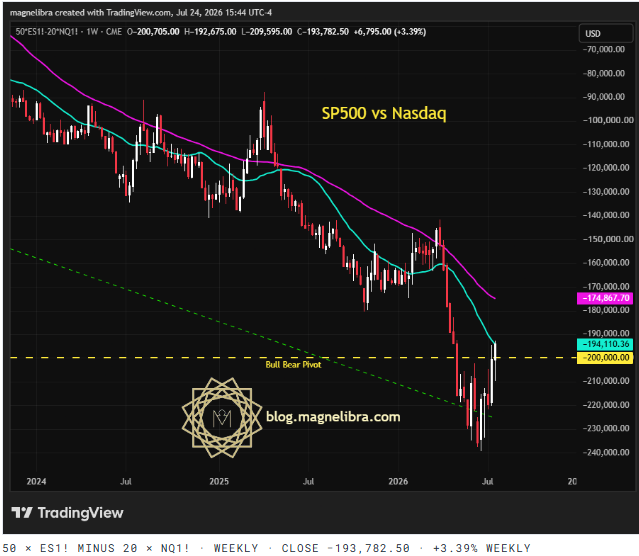
This is the chart of the week. The spread chart represents 50x ES - 20x NQ, which compares the notional dollar value of one S&P 500 futures contract to one Nasdaq 100 futures contract. When the spread declines, NQ is outperforming ES on a dollar-value basis. When it turns up, the opposite.
For eighteen months this spread has done nothing but decline as tech leadership ran unchecked. It bottomed near negative 240,000 in mid-July, and this week it printed a plus 3.39 percent weekly rally, reclaiming the down-trending line from above and pushing back toward the negative 200,000 bull/bear pivot. That is the first meaningful trend break in this ratio since late 2024.
If this holds, we are not looking at a five percent Nasdaq correction. We are looking at a leadership handoff from tech-heavy positioning back toward the broader index. Historically, when this spread turns, it does not turn back quickly. The next confirmation is a decisive close above negative 174,867, the pink moving average level. That is where the trade becomes durable.
SECTION IV Digital Currency Index: Open Access Preview
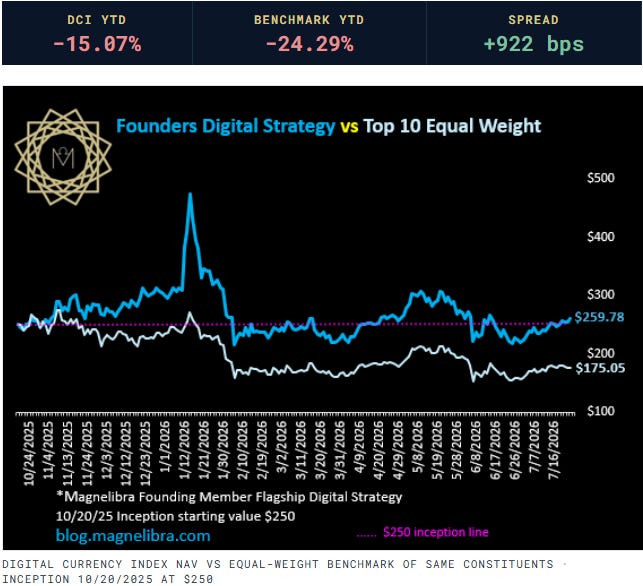
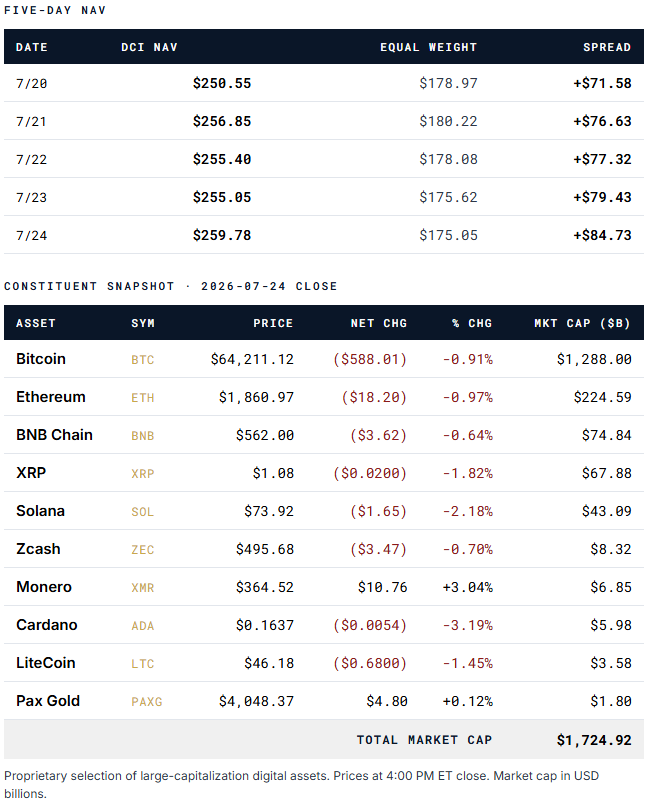
The Digital Currency Index is a Founders-tier deliverable that tracks a proprietary selection of large-capitalization digital assets on a NAV basis, benchmarked against an equal-weight hold of the same constituents. This week we are opening it up so readers can see the discipline behind it.
Since inception on October 20, 2025 at $250, the Index has held $259.78. The equal-weight benchmark sits at $175.05. That is a spread of roughly 4,800 basis points over the same constituents, held over the same window. That gap is the tracked value of the strategy.
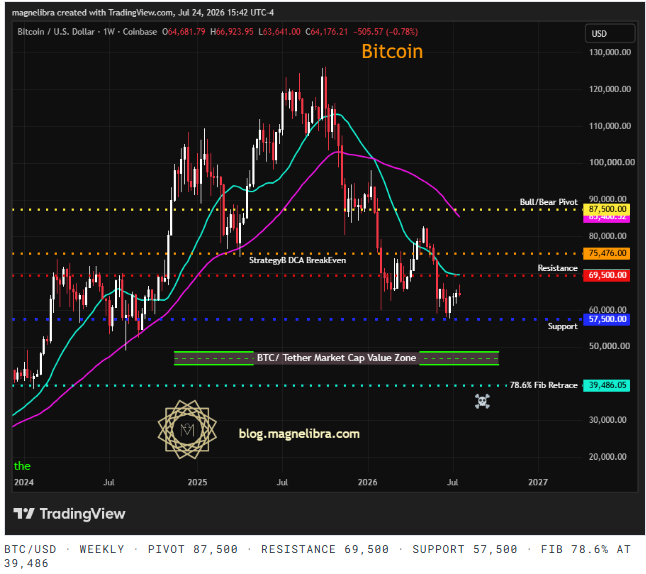
The Bitcoin backdrop. BTC weekly closed $64,176, below the $87,500 bull/bear pivot and below the $75,476 StrategyB DCA breakeven line. The 78.6% Fibonacci retracement at 39,486 remains open. (OUR OFFICIAL TARGET) The Index has held its ground against this backdrop, which is the point of tracking the spread over the benchmark.
SECTION V FTS Signal Book
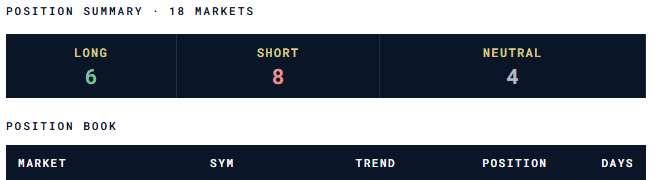
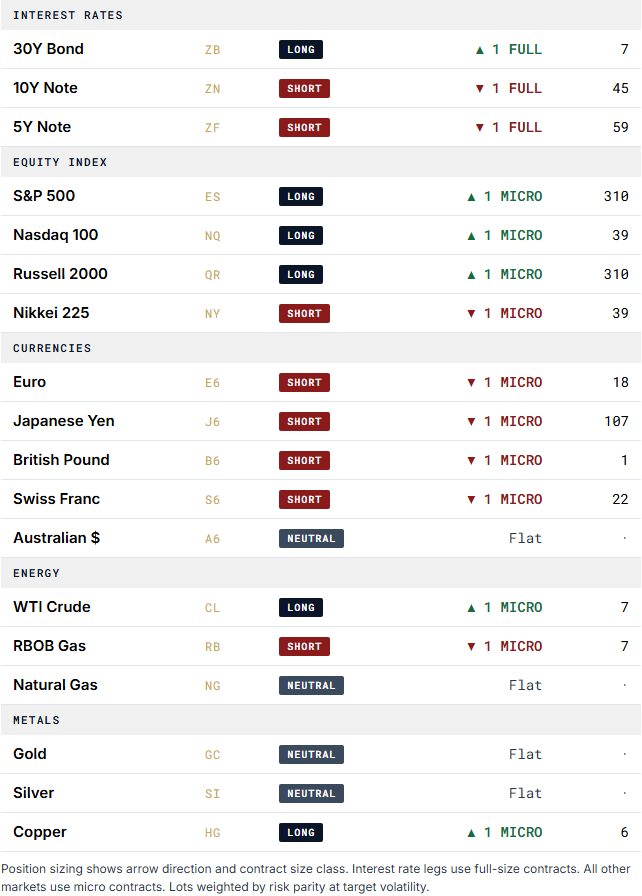
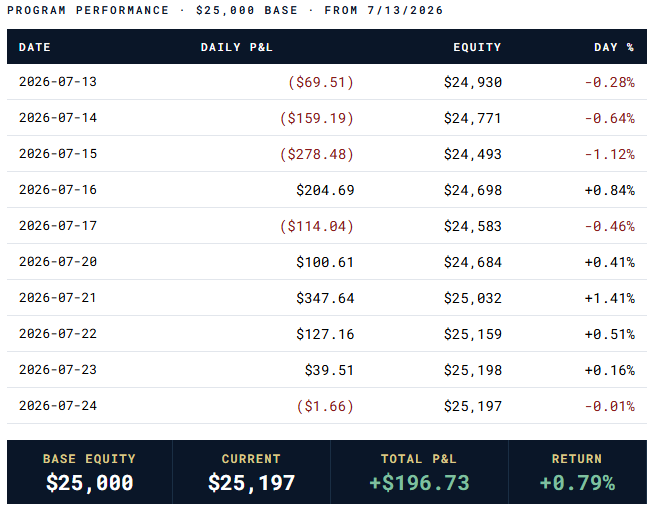
18-market core FTS. 6 long, 8 short, 4 neutral. The interest rate legs form a steepener: long 30Y, short 5Y and 10Y. Equity index book is long S&P, Nasdaq, Russell, short Nikkei. The full G4 dollar cross is short across the board. Energy is long crude, short RBOB. Metals: gold and silver flat, copper long. This is the position book on a static $25,000 hypothetical base.
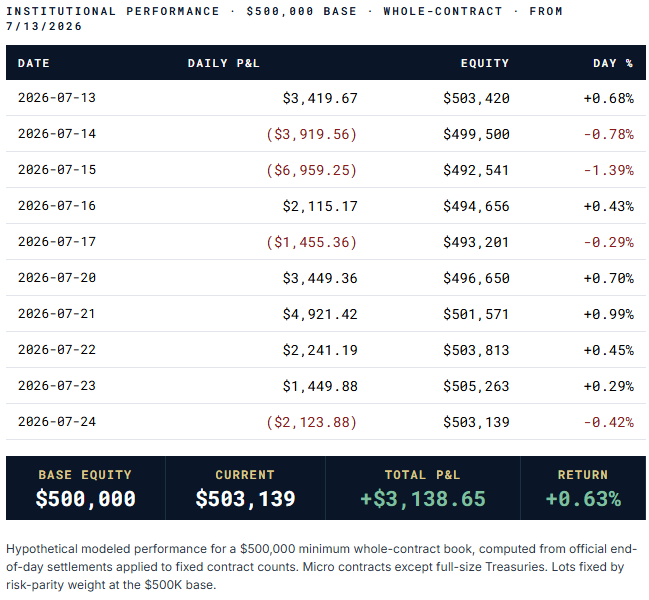
The institutional book. The same signal runs at scale. Below is the whole-contract book computed on a $500,000 minimum base, sized in fixed real-dollar lots rather than micro contracts. Direction comes from the same daily signal. Contract counts differ: the interest rate legs alone carry four ZB long, eight ZN short, and eleven ZF short. This is how the strategy translates from a hypothetical retail base to an allocator-scale mandate.
SECTION VI Next Week: FOMC
Rate decision Wednesday, July 30. Powell press conference at 2:30 Eastern. The bond market has already priced two more cuts by year end. Anything less hawkish than that gets faded fast at the front end, which is congruent with the current FTS treasury book. Watch for language shifts on labor market softness and the pace of runoff. Weekly claims data have inflected but not yet broken. The FOMC is in a very precarious position, we know that it knows that higher rates is a huge problem for our overall debt pile but the market overall believes lower rates are inflationary (a core belief that MAGNELIBRA does not agree with as you know). If you haven’t read our thesis on why higher rates actually fuel inflation now, please go back and please read:
Fiscal Dominance and the Inversion of Monetary Transmission

Fiscal Dominance and the Inversion of Monetary Transmission
We may have more to say over the weekend. Watch this space.
Magnelibra Consulting
We hope you enjoyed this open look inside the desk.
Everything here, the equity call, the signal books, the Digital Currency Index, is the same work our subscribers see every week and our Founders receive daily before the market closes. We built Magnelibra to be a resource, not a wall. Our goal is simple: help you think more clearly about hard markets, and be the best you can be at navigating them.
Let us solve life’s problems together. Use us.